10x and the largest technological improvements of all time

I was first introduced to the concept of 10x in Peter Thiel’s 2014 book, Zero to One. He says, “As a good rule of thumb, proprietary technology must be at least 10 times better than its closest substitute in some important dimension to lead to a real monopolistic advantage.”

I believe it is not just technology, but the entire customer proposition that needs to be 10x better than the status quo. In my article on the topic, The 2 Principles of Startup Success, I incorporate Clayton Christensen's concept of “jobs to be done,” which gives us a simple premise: Truly innovative or disruptive products and services offer at least a 10x improvement over how things are currently done.


Using this framework to think about new ventures is incredible helpful to entrepreneurs, start-ups, and large corporations. You should always be thinking about the value you can deliver to your customers.

The concept of 10x -- or exponential value -- is powerful. To better understand the principle in practice, we’re going to take a look at a number of 10x innovations over the past 200 years, and look for the biggest breakthrough.

Recent 10x technological improvements

Let’s start our tour with some recent technological improvements that most everyone is familiar with. The first, classic example, is the iPod.

Before the iPod came along, mobile listeners might have 15-20 songs in their pocket. The iPod gave them 1,000 songs, a 50x improvement.

When Amazon.com came along, it offered a book selection larger than 10x than that of a traditional bookstore. The Amazon Kindle continues the trend by offering a package that greatly improves the book buying and reading experience.

Given the huge selection, instant gratification purchase process, and exponential storage benefits, the Kindle offers at least a 10x improvement over the alternative -- if not more.

Tinder, the swiping dating app, is a way to meet new people. Compared to the alternative method of going to a bar to meet people (or through work, or through common friends, or through local activities, etc), Tinder makes the process dramatically easier.

Not only does Tinder offer more than a 10x improvement in throughput (the amount of people you can meet or swipe through with significantly less effort), its design also eliminates the fear of rejection, making the entire experience 10x easier and more efficient.

Another classic example of disruption, Uber offers an exponentially improved process to get from point A to point B. When the alternative is catching a taxi, Uber offers certainty, cost savings (usually), and a frictionless payment process.

The result is a 10x improved experience from start to finish.

It’s no coincidence that each of these examples is a success -- in terms of product-market fit and customer traction. There is a direct correlation between delivering exponential customer value and market traction. If a product or service is truly 10x better than the status quo, customers will flock to it!

10x improvements over the past 200 years

It’s not just the past 15 years that give us examples of 10x improvements. Reaching back a bit further gives us even more massive improvements, showing how today’s technological innovations are quite small in comparison.

It’s not a happy thought, but the development of the atomic bomb represented an exponential increase in destructive firepower.

During World War II, a typical U.S. bomber would carry around 6 tons of TNT, and bombing missions would include hundreds of these bombers. With the advent of the first atomic bomb, a single bomber could deliver up to 20,000 tons of TNT. That’s a massive 3,300x increase in destructive firepower per plane, and a 200x-300x reduction in aircraft.

The invention of railroads ushered in an era where transport costs and transit times for people and goods dropped exponentially.

Railroads made transport drastically less expensive (100x cheaper) while improving the overall customer experience and travel time -- not just incremental improvements, but exponential as well.

Likewise, the advent of air travel continued to dramatically decrease travel times.

While railroads shifted travel times from months to days, air travel moved the basis from days to hours.

If we look at transatlantic crossing times over the past 150 years we can see how long it took a passenger to travel from London to New York. Dramatic improvements in boat technology slashed travel times from 15 to four days, but it’s still not a 10x improvement. Those were incremental improvements. It wasn’t until air travel that a true 10x improvement in travel time came, reducing transit time from days to hours.

The biggest exponential improvement?

When it comes to massive 10x improvements over the status quo, there’s a clear winner from my research. This technology (and the businesses that popped up supporting it) improved communication times up to 25,000x.

The winner? The wireless telegraph.

The wireless telegraph ushered in an exponential improvement in communications, and changed the world. No longer did it take weeks for news to travel around the world. Now it happened in a matter of minutes.

Looking to the future: SpaceX

The last example is my favorite: SpaceX. In a world of incremental technological improvements and relatively frivolous tech products, SpaceX represents a return to the heady days of the 19th and 20th century, when inventions really did change our world.

The promise of SpaceX rests in its 10x value proposition through use of reusable rockets. It’s aim of a 100x reduction in payload costs to orbit is a game changer, both as a business and for us as a species. If successful, it will put space within reach for generations to come. That’s why SpaceX is such a big deal.

The power of 10x

Not every new venture can be a 10x improvement over the status quo. These technological and experience improvements are few and far between. But the quality of thinking is something that can and should be brought to every company and every new venture.

Whether you’re a startup founder or a technology executive, think about the last three products you released for your customers. What was the additional value you delivered?

Chances are that it can be measured in tenths -- a 1.1x or 1.2x improvement.

The more incremental and exponential value that you can provide to your customers, the more successful your venture will be. Not everything can be 10x, but it shouldn’t stop the thinking. So never stop asking: How can we offer an experience that is 10 times better than the status quo?

Growth in new markets: An analysis of Opendoor, Knock, and OfferPad

Last December we conducted a wide-ranging analysis of Opendoor, the real estate startup that purchases homes directly from sellers. A look at of thousands of MLS records formed the basis of that piece, showing trends and extrapolating insights from the data.

At the time there were a number of unanswered questions we wanted to dig into: how much money does Opendoor make per transaction, how big could the model really get in the U.S., and does Opendoor have a sustainable competitive advantage against competitors?

Four months later I’m once again looking at the data, with these questions on my mind:

  • What does Opendoor’s traction look like in its (relatively) new markets, Dallas and Las Vegas?
  • Are there any notable changes in Opendoor’s fundamental business operations and metrics?
  • Opendoor has two well-funded competitors in the market, Knock and OfferPad. How are they doing?

After looking at the data, there are three main observations:

  • Dallas, Opendoor’s second market, is doing remarkably well. The transaction volumes there reached parity with Phoenix after only six months.
  • Las Vegas, Opendoor’s third market, is off to a slow start. Key metrics suggest Opendoor is still finding its sweet spot in that market.
  • Knock, Opendoor’s Atlanta-based competitor, is very early stage and has yet to ramp up in any significant fashion.

A snapshot of current volumes

Last time we looked at the data (at the end of November 2016), transaction volumes in Phoenix were going strong, Dallas was on a promising upswing, and Las Vegas was still small.

Since then, overall transaction volumes have surged from around 200 home sales per month to over 300 sales per month in February. In other words, in February, Opendoor was selling ten houses each day (including weekends) across all three markets. Not bad!

This growth appears to be driven by sustained volumes in Phoenix and very strong growth in Dallas -- putting that market on par with Phoenix after only six months.

Opendoor does Dallas

Let me be clear: I’m impressed with the growth in Dallas. When I’m evaluating new businesses and new business models (see my article, The Two Principles of Startup Success), I always look for business model validation (does this work in one market?) and then the ability to scale (can this be replicated in another market?).

Opendoor’s success in Dallas is a resounding answer to that question. Yes, the business can scale beyond one market. This is a noteworthy achievement for the firm.

Like Phoenix, the average selling price in Dallas is well-clustered. During the past three months, Opendoor’s median sale price in Phoenix was $210,000, compared to $212,000 in Dallas.

This suggests that, like Phoenix, Opendoor has found its sweet spot in the Dallas market. It deals with houses in a narrow and specified value range and (generally) does not deviate from that.

Opendoor credits its success to the team in Dallas and their focus on providing customers an experience they love. “We're seeing that customer love translate to growing word of mouth, and a growing business there,” said JD Ross, one of Opendoor’s co-founders.

What about Las Vegas?

I’m so glad you asked. Opendoor started listing and selling homes in Las Vegas at about the same time as in Dallas, last September. But growth has been slow ever since.

The sale price is not as well-clustered as in Dallas and Phoenix. There’s quite a spread of prices that Opendoor sells its homes for.

The median sale price in Las Vegas is also materially higher than Opendoor’s other markets, sitting at $322,000 (compared to $210,000 and $212,000 in Phoenix and Dallas). It’s not a factor of higher house prices in Las Vegas, either. According to Zillow, the median home price in Las Vegas is $209,000 and the median listing price is $247,000 -- which is on par with Phoenix and Dallas.

In Phoenix and Dallas, Opendoor is selling homes for roughly the market’s median home price. But in Las Vegas, it’s considerably higher.

Opendoor has been selling homes for six months in Las Vegas; perhaps its median sale price started high but has been falling to normal levels over time? Nope.

There’s a noticeable oddity in the Las Vegas market, with slow growth, a less-clustered sale price, and a sale price that’s higher than normal. Why?

It’s because Opendoor’s approach to the Las Vegas market is different. “In Vegas we've been focused on partnerships, and haven't pushed to expand to the broader market there yet,” says JD.

This is a different approach than Opendoor has taken in its other markets, with correspondingly different results.

Opendoor has partnered with Lennar (a new home builder) to offer the Lennar Trade Up program for Las Vegas homeowners. It’s a way for homeowners to “trade in” their existing homes to Opendoor as part of a package to buy a new home from Lennar.

This is a different approach than Opendoor has taken in its other markets, with correspondingly different results. My guess is that it’s a lower-cost option for the firm that effectively outsources lead generation to a partner while allowing Opendoor to focus efforts elsewhere. In other words, it’s a test, which is exactly what a you’d expect from a young, growing company.

Knock, Knock

Since the last analysis, two well-funded competitors have entered the U.S. market: Atlanta-based Knock and Phoenix-based OfferPad. Both announced that they raised over $30 million each in January of this year.

Knock is live in Atlanta and currently trading with tiny volumes; we’re talking about one home sold each of the past two months. It also has a very small number of new listings each month, anywhere between one and six over the past four months.

Knock either does not have the price discipline we’ve seen work so successfully for Opendoor, or is not yet enforcing it.

The median sale price for Knock’s ten listings that sold is $290,000. But underneath that, if we look across all listing prices, you can see they’re not clustered at all. The home values are all over the show, meaning Knock either does not have the price discipline we’ve seen work so successfully for Opendoor, or is not yet enforcing it.

There are several key takeaways in looking at Knock:

  • This is a difficult business to be in. Raising money doesn’t give you market share. It takes time, skill, and good operations to build scale.
  • Knock is super early stage. Its transaction volumes suggest it is still tinkering with its core operations and proving it can make the model work before attempting to scale up.
  • Price discipline is important. It may be tempting to deal with higher-value homes where the fees are correspondingly higher, but Opendoor has shown us where the sweet spot for this model really is.

OfferPad, on the other hand, is a more mature business with better traction -- at least in the Phoenix market. With the help of friends at ATTOM Data Solutions, a real estate data company that aggregates data directly from property records (as opposed to my usual MLS sources), I was able to gather a snapshot of relative traction for both businesses in Phoenix.

It's worth a deeper dive into OfferPad, its model, and relative merits. But that will have to wait until another time.

A look at Opendoor’s operations: anything interesting?

To wrap everything up I took a quick look at Opendoor’s core business metrics to see how things are tracking.

To begin with, the much-talked-about home value appreciation has stayed the same with a median average of 5.4% (looking at 43 recent sales). That’s the difference between what Opendoor buys a home for and eventually sells it for -- about $11,000.

And listen: That’s the difference between the buy and sell price. Opendoor takes on a number of costs associated with sprucing up, holding, and selling a house. So don’t confuse that number with profit; it’s not.

If you prefer small dots to blue bars, below is another way to visualise the same data.

The average days on market in Phoenix has seen a slight improvement, moving down to a median average of 41 days from 47 days in the last analysis. That’s a 12% improvement, which if I were running the business I would have as a key metric. It’s a small improvement -- but when time is money -- a welcome one!

Opendoor also has a new logo.


It will be interesting to watch Opendoor’s progress from here. With Phoenix and Dallas firing well, will it expand to a handful of new markets, or is Las Vegas the next area of focus? When it enters new markets, will it follow the partnership model? And will Opendoor launch in Atlanta before Knock puts the foot down on the accelerator?

Are you researching iBuyers like Opendoor and on the hunt for data? Do you work at a consulting or venture capital firm? Check out the iBuyer Analysis Pack.

easyProperty: lessons in how not to build a business

On March 29, easyProperty released its full year 2016 financials to the U.K.’s Companies House. While a few days early, it turns out that it wasn’t an April Fool’s Day joke. The numbers announced begged to be looked at further.

EasyProperty, launched in 2015, is a hybrid online estate agency in the U.K. It has a similar business model to Purplebricks and eMoov, which aim to sell houses for a low, fixed fee instead of a percentage-based commission, and thus disrupt the traditional real estate agency and brokerage model.

EasyProperty has raised just shy of of £40 million since inception, making it one of the best-funded entrants in the field (second only to Purplebricks).

What drew me to this story is the sheer amount of money raised and subsequently spent. According to its filings, easyProperty had a full year loss of £11.4 million in 2016, having lost £6.8 million the year before.

And what did that money buy? A staggeringly small £874,000 in revenue for 2016.

How did easyProperty manage to spend so much money and achieve such little market traction? It’s a crowded space, but there are a number of other players making significant gains. To me, this is a lesson in how not to build a business.

The Purplebricks comparison

Let’s look at Purplebricks for a comparison. It’s a direct competitor as a hybrid online estate agency, also a start-up, and because it’s publically listed has financials we can analyze (which I did so here, looking at how Purplebricks has successfully scaled).

Let’s start with an overview using the most recent data available. For easyProperty, this is its full year 2016 results. For Purplebricks, we have its half-year 2017 results, announced last December.

While the time periods don’t match up, it’s clear to see the disparity between spend and traction.

What’s striking is not how much money easyProperty is spending, but how little return it’s getting for that spend. Back when the business launched, Mr. Ellice, the CEO, is quoted as saying the company expects to be listing 4,000 to 5,000 properties each month by 2016. Two years later, the reality is around 80 properties per month.

There are a few interesting ways to slice this data. First, let’s look at the total cost per listing. This is what each business is spending per listing. Clearly there will be economies of scale and it should be nonlinear, but looking at the metric is illuminating!

EasyProperty is spending around £12,000 for each of its listings, compared to around £1,000 at Purplebricks. That’s not a great return for the massive sums being spent.

At a higher level, we can also look at how much easyProperty is spending for each £1 in revenue. Spoiler alert: it’s not pretty.

So while Purplebricks is spending around £1 for every £1 in revenue (breakeven), easyProperty is spending £14 for every £1 in revenue. That’s an outrageously bad return on investment.

If easyProperty had simply given away 1,000 listings at its list price of £825 each, it would have cost the firm less than 1/10th of what it ended up spending in 2016.

Technology is not a key differentiator

There’s a choice quote in the director’s report: “The directors consider the level of technology within the business to be more sophisticated than its competitors in its capacity to be able to create and maintain product catalogues across multiple verticals and territories, including product variations, variable pricing and packages that may or may not have optional elements.”

I fundamentally disagree with the premise that technology is a key differentiator or represents a sustainable competitive advantage in this space. I’ve researched and spoken to dozens of leaders in this field around the world, and I’ve yet to find a correlation between an amazing technology platform and market traction.

As I recently wrote in my analysis of eMoov’s technology platform, the winning combination is people + technology. And as the eMoov case study makes clear, technology is only as good as the business behind it.

In other words, the fact that your technology supports packages that “may or may not have optional elements” is not a reason to think the business will succeed against competitors.

With a tech team of 26 developers (compared to eMoov’s tech team of nine), my sense is that easyProperty just needs to get on with it and stop investing millions in its technology platform.

Mo’ Money, Mo’ Problems

There are a number of businesses in this space around the world. The most successful have a great customer proposition and scrappy, driven founders with a burning desire to change the industry.

The director’s report states, “...as is typical for businesses at this stage of their lifecycle it is generating start-up losses as it uses working capital to develop the business.”

I’m not sure that I would describe this situation as “typical.” Purplebricks generated losses to build the business. EasyProperty is just spending a lot of money.

The technology behind an online real estate agency: Lessons from eMoov

Online agencies are one of several new models gaining traction in residential real estate. They smartly combine the traditional expertise of professionals with efficient new technologies to provide a low-cost alternative to traditional real estate agencies and brokerages.

Their rise around the world is slow, but the impact they are having is unmistakably big. The top player in the U.K., Purplebricks, has a market capitalization approaching $1 billion after going public in December 2015. 

Collectively, online agencies have around 5 percent market share in the U.K. and are putting the incumbents under increasing pressure. And the battle in the U.S. is about to heat up with Purplebricks raising $62 million to enter the market in the second half of 2017.

The value proposition of online agencies typically consists of a low fixed-fee and an improved customer experience. Technology plays a key role; online agencies rely on it to empower consumers, bring transparency to the transaction and improve overall efficiency (thus allowing them to charge lower fees).

If technology is a key point of difference, what exactly does it do? What does it look like and how does it add value to the transaction?

Tech is a critical component of an online agency’s value proposition. Here, we’re going to dive deeper, looking at exactly what this tech looks like for a leading online agency, how it adds value and what lessons we can learn.

Case study: eMoov.co.uk

EMoov is one of the leading online agencies in the U.K., having served over 20,000 customers since its founding in 2010. 

EMoov’s technology platform started development in 2013 and is currently on its third iteration, which is one of the big reasons eMoov is appealing as a case study. Not only has the tech platform been in operation for around four years, the team behind it has had a chance to learn and iterate.

Another important factor: The technology is being used at scale. The company lists between 300 and 400 homes each month, and it expects to list nearly 7,000 homes in 2017. This is not technology built in a basement without users — it’s battle-tested in the field and being used to sell homes.

At a high level, the technology platform does two main things:

  • It empowers customers in a way that allows transparency and control over the transaction.
  • It reduces costs at scale by making eMoov’s internal agents more efficient.

EMoov believes technology plays an important part in real estate by empowering customers and making agents more efficient. But it also believes property professionals are still needed in certain areas, like negotiation.

Ivan Ramirez, eMoov’s CTO, sums up his philosophy: “It was important for us to fully automate certain parts of the journey, like property onboarding, a well as viewings, but we knew that other parts, like offer negotiations and progressions, was an area where we needed to keep the human element present.”

“We still use technology in these areas of the selling process, but it’s more focused on empowering the agent and providing transparency to the customer,” Ramirez added.

A history of iteration

“Historically, technology has been absent from the property transaction, save for search via the portals and agent-facing office management software,” said Russell Quirk, eMoov’s CEO.

Russell thinks that a number of the players in the online agency space, in addition to all of the participants in the traditional sector, grossly underestimate the amount of work required. “It’s a two-year project at a minimum and a massive seven-figure investment,” he adds.

EMoov’s technology has gone through a number of iterations, not all of which have been successful. “We’ve ripped up an entire build and thrown it away and a team with it,” Quirk said. “We adopted a waterfall approach and just didn’t listen to the customers. We focused more on the solution than understanding the problem.”

Now, however, the team is firing on all cylinders and innovating, iterating and deploying new features on a weekly basis.

Ramirez and his team of product managers spend a lot of time in the trenches, shadowing agents dealing with customers, understanding the existing process and looking at customer feedback from support tickets. 

“The goal was to pull out meaningful feedback that would allow us to challenge the existing business processes,” Ramirez said.

“We looked at our internal team’s business processes even further, as well as our customers’ desired journeys, information they wanted to see, and how to present it all in a way that makes sense to them. The way our customers and our internal agents consume and interact with the product is completely different.”

Ramirez believes in a process of continuous improvement and that a product is never complete. 

He’s also implemented a culture of product development that aligns to key business metrics. 

Everything that’s built has an associated metric to be measured against. In his opinion, this is why eMoov is able to operate a business at a low cost while keeping a high level of customer service.

Enhancing the customer journey

“Customers of all ages and demographics embrace being in control and having 24/7 access to their listing and their transaction,” Quirk said. By presenting everything to its customers, eMoov is able to bring a strong degree of transparency to the process.


The property dashboard gives users — both homesellers and eMoov’s agents — a comprehensive look at the property listing. 

Relative listing popularity and key performance metrics from the major listing portals (Rightmove in the U.K.) are shown alongside a snapshot of viewings and potential buyer feedback.

EMoov has attempted to automate the entire process of scheduling viewings. Sellers define the times they are available to show the property to potential buyers. The company’s agents then work within these timeframes to help schedule showings for the seller.

On the other side, potential buyers are presented with an online tool to schedule a viewing, as seen below.

The entire process occurs online for the more than 5,000 viewings that eMoov arranges each month. And it’s more efficient; 93 percent of viewing confirmations now occur online automatically. “We’re now doing this with half the staff that we were deploying to do half as many viewings a year ago,” Quirk said. 

Improving team efficiencies

Ramirez subscribes to a Warren Buffett philosophy, which is that successful businesses need to be low-cost operators. “We have been able to significantly decrease the cost of service in the first part of the seller journey by really operationalizing the product in a way that makes every contact that we do have with our customers more efficient,” he adds.

“In an omni-channel approach, this is a must to succeed as you need to be able to service that customer in whichever way they want to be serviced at different stages of the journey,” Ramirez said. “It’s very difficult to force a customer through a rigid interaction, so the product needs to be flexible and empower whomever engages with it.”

As an example, the customer onboarding process is how a new listing gets on the market. It typically consists of the following steps:

  1. Provide property details (description, rooms, highlights and so on)
  2. Set the selling price
  3. Schedule the photographers to come take the photos
  4. Set viewing availability
  5. ID checks

A year ago, the steps listed above were all done manually. Today, 90 percent of eMoov’s customers do the steps above on their own using the tech product. This “hand-holding” approach has been transformational for its business and significantly tightened the time it takes to list a new home.

The impact on cost is equally material. The team that supports this operation had 15 people, but now the firm only needs nine people to handle nearly double the number of new customers. Historically, productivity has chugged along at less than 60 cases per person, and now the team is up to over 100 cases per person.

EMoov currently has around 50 staff members, of which seven are engineers and two are product people. 

In comparison, there are 11 staff members in offers and progressions and eight in support. It’s this combination of intelligent tech plus experienced property professionals that makes the entire operation efficient and successful.

The platform essentially has a workflow functionality that puts tasks in front of the agent, helping to progress the sale one task at a time. “It takes the thinking out of the progressions job,” Ramirez said. 

The platform also manages the chain on the property being sold, as seen below, giving a holistic view of the entire transaction.

Lessons learned and future plans

Some of eMoov’s biggest wins have been around customer onboarding, automated viewings and collecting feedback. Each of these areas has benefited greatly from technology to streamline and automate the process.

On the flip side, one area that surprised the team was virtual tours. “Virtual tours didn’t add any value to our listings. We didn’t see a faster time to offer; we didn’t see less or more viewings,” Ramirez said. 

When evaluating interesting new technologies, eMoov is in a unique position as it sits across the entire transaction and can see the utility (or lack thereof) of adding new features like tours.

EMoov has identified machine learning, artificial intelligence and chatbots as areas of future, long-term focus. 

Developments in these tech realms can improve service areas like valuations and viewings. 

In the short-term, however, the focus remains on iterating the offers and sales progression components of the platform to improve efficiencies and give customers more control and transparency.

Final thoughts

No matter what your role in the industry is, there are lessons to be learned from what online agencies like eMoov are able to bring to the market. 

Namely, that there’s room to provide homesellers an improved experience. Technology plays an unmistakably important role in enhancing the customer experience of buying and selling real estate.

As someone who looks at a lot of businesses in real estate tech (with a focus on finding winning models), I see a number of key takeaways from the eMoov story:

  • The winning formula is technology + people. You need both to succeed.
  • Success comes from more than technology and user interface; it’s the team, the methodology, and an ethos of continuous improvement.
  • A good tech product is a big investment and long undertaking and can’t be acquired off-the-shelf.
  • Ultimately, the product must be good for consumers. It needs to add value and make the transaction easier and more efficient through transparency and automation, 24/7.

Observations on Zillow's 2016 results and the U.S. market

Hey, Zillow! Thanks for reporting your full year financial results for 2016. It provides a great opportunity to update my international property portal analysis and draw out a few observations on the U.S. market.

Let’s start with EBITDA

The first thing we need to understand when talking about Zillow is its EBITDA. As I have written in the past, Zillow reports non-GAAP “Adjusted EBITDA” numbers, which exclude stock-based compensation (SBC) costs. Many large U.S. tech companies now include SBC costs in their numbers, which is the generally accepted part of GAAP (generally accepted accounting principles). It’s also necessary to do this for an apples-to-apples comparison to international property portals.

Zillow’s 2016 Adjusted EBITDA is $144.8 million. Once we include SBC costs of $106 million, that drops down to $37.9 million. If we then include the negative impact of the $130 million litigation settlement with News Corp, we arrive safely in negative territory. But for comparison purposes, we’re going to stick with an EBITDA of $37.9 million; the litigation settlement was truly a one-off.


With 2016 revenues of $846 million and EBITDA of $37.9 million, Zillow has an EBITDA margin of 4.5% (far less than its reported 17% using Adjusted EBITDA numbers). As you can see below, that margin is well-below international peers.

Zillow claims that it can reach 40% EBITDA margins “at scale,” which is on par with its international peers. I suspect that number is using Adjusted EBITDA figures, which would not be an apples-to-apples comparison with the peers above.

I highly doubt that Zillow can go from an EBITDA margin of 4.5%
to an EBITDA margin of 40%. 

Zillow is projecting 2017’s revenues to crack $1 billion with Adjusted EBITDA of around $200 million. Assuming stock-based compensation costs of $110 million, that implies an EBITDA of $90 million and EBITDA margins of 8.7% -- nearly double 2016’s levels.

The chart below shows Zillow’s Adjusted EBITDA and EBITDA margins over the past 4 quarters. There was a big jump into profitability in the third quarter of 2016, which has subsequently levelled off in the fourth quarter.


A $200 million Adjusted EBITDA in 2017 looks pretty similar to extending the last two quarters out for the entire fiscal year (the blue line in the chart above), with around $50 million of Adjusted EBITDA per quarter. That implies a relatively flat trajectory when it comes to earnings (in other words, expenses will track higher with revenues).

But does it scale?

I’m interested in understanding how well the Zillow business model scales. When I think about scaling, I think hockey stick curves where revenue grows at a faster pace than expenses. Making more money by spending the same amount – that’s scaling. (For more on scaling in real estate, see Purplebricks results show promising trends written by yours truly.) 

The chart below shows historical revenue and expense growth. In 2016, revenue and expenses both grew at 31%. I’ve forecasted 2017 below based on Zillow’s revenue and Adjusted EBITDA guidance, which implies revenue growth of 23% and expense growth of 13%.


If Zillow can pull that off, it shows the business model has the ability to scale. But judging its historical numbers only, the graph is pretty clear – it’s not scaling; expense growth is keeping pace with revenue growth.

If we look at the previous seven quarters, we see another story of revenue growth. There is no accelerating upward trajectory; in fact, growth is slowing down. 

Going macro

I find it helpful to look at revenue potential from a macro level. How much more room is there to grow revenues in the U.S. market?

Let’s look at the average monthly revenue per advertiser (ARPA). The chart below highlights Zillow compared to international peers and suggests a nice uptick in ARPA, placing Zillow in the middle of the international pack. But it also suggests incremental, rather than exponential, room for growth.

Zillow is again middle of the pack when it comes to revenue per employee. This suggests a limited ability for Zillow to monetize on a radically different expense base (in other words, it probably can’t extract much more revenue without adding more expensive headcount).

At a high level, 2016’s results have moved Zillow up in the pack when it comes to overall monetization relative to population size. In the chart below, REA Group, Domain, and Trade Me Property all operate in a vendor-funded market (meaning home sellers pay for marketing costs, not agents). So Zillow is again middle of the pack for peers in the remaining markets. 

At a macro level and compared to its international peers, there is little to suggest that Zillow can achieve an outsize revenue growth going forward. 

Zillow and the U.S. market

To wrap up, there are a few observations that stand out from Zillow’s results and the overall international analysis:

  • We can’t use Zillow’s “Adjusted EBITDA” numbers; it doesn’t paint an accurate picture of the business.
  • 2017 is the year when Zillow can prove its business model scales. There is very little in the data above to suggest that revenue growth can materially outstrip expense growth.
  • Zillow can and will be profitable, but it will be from relatively low margins on a large base. It will be difficult to reach its intended 40% Adjusted EBITDA margins, let alone anything close to that when you include stock-based compensation costs.

The 2 Principles of Startup Success

Launching a startup or new venture takes many things: perseverance, timing, luck, a great team, and a workable business model. Whether it’s launching a new startup from scratch, or a larger corporate launching a new product, success often comes down to two key principles.

I’ve found the following framework to be the fastest and most effective sanity check to establish if a new venture will succeed or fail.

#1 The Principle of Quality: you must provide more perceptible value than the status quo.

Simply put, a new venture needs to provide more value to users than the other available options. If we use Clayton Christensen’s framework of “jobs to be done” as a basis (booking a flight, hailing a cab, keeping track of customers, or buying groceries), then the value of the new needs to exceed the value of the current.


Value can be defined many ways: cost, utility, and convenience are fairly standard measures. The value is what the user perceives and experiences on an individual basis, not what the provider thinks. Value originates with the user, not the new venture.

The increased value needs to more than offset the activation cost of the new venture. This could be the cost associated with downloading a new app, completing a registration form, driving to a different part of town, or entering credit card details. There is always a cost associated with doing something new, and if a user perceives that the cost is greater than the value they’ll derive, they won’t switch. Pro tip: make your activation costs as low as possible!

If you must explain your value, it’s not as great as you think. 

If the value of the new is relatively close to the value of the current, you enter what I call “The Grind.” This is the unenviable position where you need to convince customers of the value you provide. As Jeff Jarvis eloquently states in What Would Google Do?, if you must explain your value, it’s not as great as you think.

Here are a few real-world examples:

  • The Facebook phone -- a failure because it didn’t offer enough perceptible value versus people’s existing phones. Users already have the Facebook app.
  • Uber -- compared to hailing a taxi, the app provides enhanced value by streamlining payments and real-time trip tracking -- all for (usually) less money.
  • Amazon Prime -- shipping is better when it’s free, plus access to thousands of free movies and TV shows is an easily perceptible value. Other retailers don’t offer free movies and TV shows, and Netflix won’t ship you millions of products for free.
  • Customer relationship management systems -- new ones typically involve the “UI value fallacy,” which is when you think a new user interface is enough of a value-add for users. It’s not. You need to provide more value to your users and help them do their job. I’ve seen plenty of ugly software packages that are very successful.

#2 The Principle of Quantity: you must have a potential market large enough to be profitable.

Providing value to customers is an important first step, but a business needs enough customers to sustain itself. Generally, the more customers you can serve, the better!


So how large is large enough? It depends on the product or service and the revenue model. Typically, the more qualifiers there are in answer to the question “who are your users?”, the more problems you’ll have.

It’s ok to start with a subset of your market, but it’s the total potential market that matters. 

A good answer sounds like: a product designed for real estate agents.

A poor answer sounds like: a product designed for real estate agents in Minnesota showing luxury homes to Chinese buyers.

It’s ok to start with a subset of your market, but it’s the total potential market that matters. And the total potential market should be large enough to effectively monetize and sustain your business.

Tesla is a great example. Its first car, the Roadster, was an all-electric sports car starting at $109,000. There’s a pretty small market for a vehicle like that. Its next car, the Model S, a luxury sedan starting at $71,500, has a much larger potential market. And its planned Model 3, an economical sedan starting at $35,000, has a very large market indeed.

Tesla’s strategy was to start small, building up the experience and expertise necessary to launch a mass-market electric vehicle.

Here are a few more real-world examples:

  • AirBnb -- hundreds of millions of people stay in hotels every year, giving AirBnb a huge potential market of travelers for its service.
  • Waterboy -- an app for parents to receive live updates from their children’s sporting games if they can’t attend, in New Zealand. A target market that's too small.
  • Spotify -- hundreds of millions of people listen to music every month, on their phones, in their cars, and online -- and are all potential Spotify users.

Where does your new venture stand?

When you plot both principles on a simple 2x2 matrix, you can clearly see the sweet spot you want a new venture to operate in.


The matrix above forms a simple framework to help make decisions. If you have several ideas for various new ventures, plot them on the matrix. Aim for ventures that offer the biggest value for the biggest market, and shut down (or rework ideas) that fall into the other quadrants.

Using the 2 principles in practice

Any new venture should be run through the following steps:

  • Accurately identify the status quo “job to be done” that the new venture is addressing. How do its potential users currently complete the task at hand? Remember, the analog might be non-technical and offline (ex: project management via post-it notes).
  • Roughly determine value. Use intuition, focus groups, or paying customers as the ultimate litmus test. If you’re doing this with a small group, form your opinions individually to avoid groupthink.
  • Figure out the potential market size. Are there enough potential users for it to be a worthwhile endeavor? If X users pay Y dollars, is the result big enough?

Always keep these two principles in mind when launching a new venture. Adhering to them won’t guarantee success, but ignoring them almost certainly guarantees failure.

Don’t Talk to Your Customers

I recently had two separate conversations with founders of young companies. Both were talking about strategies to grow their businesses, and my suggestion to each was to stop talking to their customers.

In each case, the business was small and growing, only capturing a small portion of the total addressable market.

As an example, let’s say your company is in the real estate technology space, and you’re selling a software solution to real estate agents. There are 1,000 possible buyers of your technology in your launch market. And perhaps you’ve signed 50 of them up as customers.

Unless you have customers paying you real money, they’re not customers. 

First off, the ultimate test of market acceptance is a paying customer. I don’t care about positive feedback, promises to sign up, or people on free trial accounts. Unless you have customers paying you real money, they’re not customers.

When you talk to your 50 paying customers, you’re talking to people who are already sold on your product. They’ve already evaluated it and have made the decision to use it in their business. Anything you learn about their pain points, the problems you’re solving, or why they like your product is nothing new to you.

If you want to grow, you need to talk to the other 950 people, the people who aren’t customers. You need to understand their specific needs and exactly what it would take to get them as paying customers.

If you only talk to your paying customers, you’re just going to reaffirm your existing assumptions in a very small, unrepresentative sample size. You won’t learn anything new. You’ll get nothing more than a distorted view of the entire 1,000-customer market.

This is a very dangerous position because it reinforces your existing prejudices. You won’t learn and you won’t grow. In fact, with that reinforced view, it may be more difficult for you to adapt your product or business model to appeal to the larger market. This tendency -- called confirmation bias -- is especially difficult for a young founding team to deal with.


I’ve seen a number of businesses fall into this trap. They achieve some small degree of success and sell their product to 50 customers. They only talk to the 50 and reassure themselves that their product is amazing. They spend their time wondering why no one else is buying it, and instead of talking to the 950 to understand their specific needs, they keep running into brick walls when no one wants to buy. They never grow, and end up in the category of zombie businesses; just successful enough not to fail.

So: don’t talk to your customers. If you want your business to grow, find the people that should be buying your product or service but are not, and spend your time talking to them instead!

The problem with bots

Everyone is talking about the rise of chatbots in real estate and they’re all overlooking a key issue: consumer value.

Bots are being heralded as an important trend for 2017. As Chris Rediger writes in Realtor Magazine, bots are “a solution to engaging potential customers in meaningful conversation.” James Dearsley chimes in, saying the “power of the chatbot can be used as an entry point customer engagement tool for agencies.”

Bots are being positioned as a valuable tool for real estate agents. But bots face a problem of value asymmetry: what’s good for a real estate agent is not necessarily good for the consumer.

Defining value

Bots are positioned as a tool to help real estate agents. By automatically nurturing online leads, a bot saves an agent time and energy, and delivers them hot leads on a silver platter! The value goes to the real estate agent.

But what about the consumer?

If bots are going to be successful, we need consumers to actually use them. Why would a home buyer or seller use a bot? What’s the value for them?

Structurely has launched a real estate bot, Holmes, to grow and nurture leads. The web site offers a compelling vision of how this is good for agents, but I question the consumer value. Consider the following screenshot from their web site:


Compared to the search experience on Zillow:

(The “More” option is for updated kitchens.)

It’s the same thing. The value proposition for consumers is identical to conducting a search on a major property portal.

I get that bots can have conversations with potential consumers, but how much value does that actually add? If I’m searching online for a home, I really don’t want to have a conversation about it; I want results.

The trust factor

The second problem with bots—and a critical concept to understanding their eventual usage—is one of trust. Simply put, will consumers trust a bot over a human?

As Andy Soloman states, “Research has reached the point at which IBM Watson can replicate what a physician or GP is saying 90% of the time. As a patient, however, who are you going to trust more? A robot, or a real doctor sitting in front of you telling you what’s wrong?”

Buying a home is a massive transaction in someone’s life. Will consumers trust a bot for something this important? They may use them for a more efficient home search process, but I don’t believe people will ever put a bot—or technology, for that matter—on the same level as a human. That’s why we have engineers in front of our trains and pilots in our cockpits. When it really counts, we trust humans more than machines.

A bot will never replace the role of an agent—an actual human being—in the real estate process.

This leave bots with a narrow focus of utility, primarily around information-gathering and answering questions. But these are two areas where strong alternatives already exist, specifically property portals and real estate agents.

How bots can be successful

For bots to be successful (which I think they can be), we need to focus on the additional value they can provide to consumers. This value needs to exceed what consumers already get from alternatives.

I’ve previously written about the principle of quality: when launching a new product, you must provide more perceptible value than the status quo.


And remember: if you must explain your value, it’s not as great as you think.

In the case of bots, the value being provided to consumers is, at best, on-par with what they can currently get. In fact, I would argue that in many cases it is sub-par because of the limitations around language processing. I know exactly what I’m getting when I set search criteria on a portal; with a bot, I’m never quite sure it will understand me.

To use another real world analogy, let’s consider automated customer service hotlines. Would you rather navigate a maze of “press 1 for... ” and “tell us how we can help you…”, or would you rather be connected to an actual human being? These hotlines are good for businesses, but are they good for consumers?

I believe in the long-term promise of chatbots. But for bots to provide true utility, we need to change the conversation.

So whether you’re an agent thinking about using a bot in your business, or a tech vendor trying to sell bot technology to real estate agents, please, let’s start talking about how bots are good for consumers, not just agents.

Key insights from a global property portal analysis

I'm big fan of data and an even bigger fan of data visualizations. I track a lot of data on the major property portals around the world. Today, we're going to look at three key insights from that analysis.

If you follow my writing you've seen this first chart before. It shows a financial comparison of the major property portals. This time around, the major change is an effort to present a true apples-to-apples comparison by normalizing EBITDA -- by using generally accepted accounting principles and including share-based compensation as a true cost.

Source: annual reports, company presentation and analyst coverage. All information based on the last full year's results (2015 or 2016).

Source: annual reports, company presentation and analyst coverage. All information based on the last full year's results (2015 or 2016).

This has the immediate effect of worsening Zillow Group's 2015 financial results, and making it the only major portal to lose money. But it also leads to the first insight...

Insight #1: Zillow Group is at a turning point

Stock-based compensation (SBC) is the practice of compensating employees with stock instead of cash. According to generally accepted accounting principles, or GAAP, this form of compensation should be included as a cost. But when Zillow Group reports earnings, it does so as "Adjusted EBITDA," which is non-GAAP, and does not include stock-based compensation as a cost. Large technology companies like Amazon and Facebook now admit stock compensation is a normal cost. For a true apples-to-apples financial comparison, we need to include these costs.

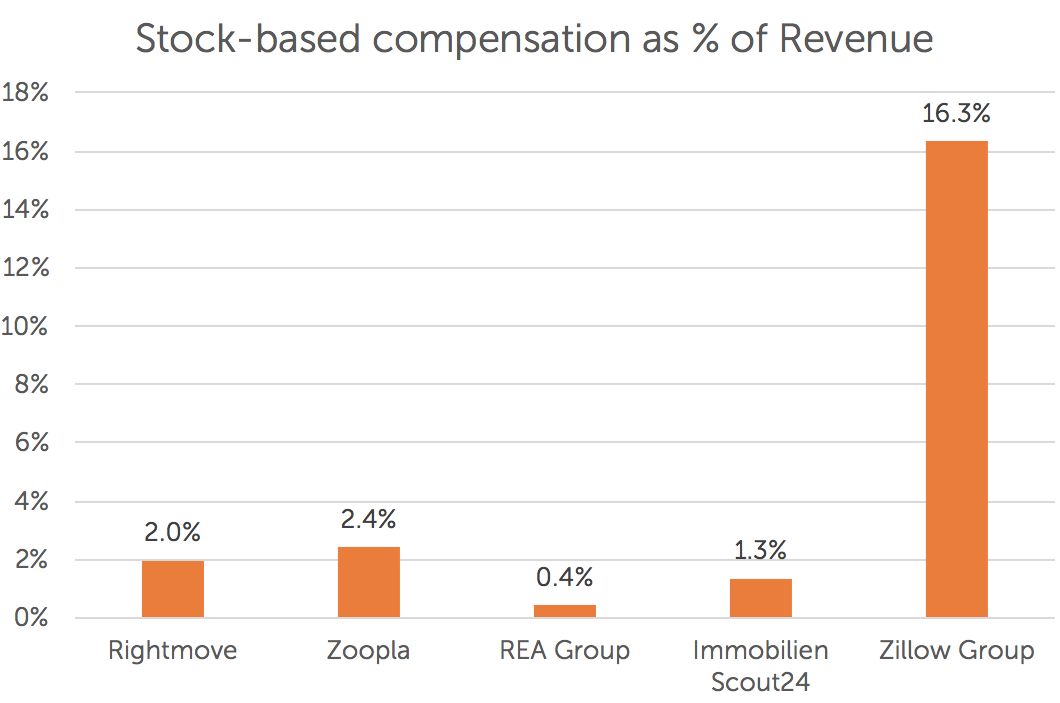
The issue is that Zillow Group issues a lot of stock to compensate its employees! Over $105 million in 2015 alone, or 16% of its total revenue. Compared to peers around the globe, that's a big number we can't ignore.

 
Source: annual reports and company presentations.

Source: annual reports and company presentations.


We should also consider Zillow's latest quarterly returns for more recent trends. In the chart below you will see its reported EBITDA numbers excluding and including share-based compensation (SBC). It's the difference between profitability and unprofitability.

 
Source: Zillow Group's quarterly results.

Source: Zillow Group's quarterly results.


The last three quarters show a promising trend of profitability! Even when including stock-based compensation costs -- which forms a more accurate picture of financial health -- Zillow is finally managing to turn a profit.

In its last full financial year, 2015, Zillow was growing on-par with its global peers (as per below).

Source: annual reports, company presentations and analyst coverage. All information based on the last full year's results (2015 or 2016).

Source: annual reports, company presentations and analyst coverage. All information based on the last full year's results (2015 or 2016).

But if the last three quarters are anything to go by (as per below), we can expect Zillow to pull ahead of the pack in a very meaningful way when it reports its 2016 full-year financial results.

 
Source: Zillow Group's quarterly results.

Source: Zillow Group's quarterly results.


The signs are promising for Zillow. Revenue growth is accelerating and it's demonstrating an ability to turn a profit, even when including share-based compensation costs. It's at a turning point and should be watched closely.

Before we leave Zillow for our next insight, it's worth throwing in the following chart on board of director composition.  I believe diversity is fundamentally important.

Source: company annual reports and investor web sites.

Source: company annual reports and investor web sites.

Why so blue, Zillow?

Insight #2: REA Group is a true global leader

I often speak about REA Group being a global leader, but the data below shows just how much they're blowing everyone else out of the water. Let's start with the average revenue per advertiser (ARPA) below.

Source: annual reports, company presentations and analyst coverage. All information based on the last full year's results (2015 or 2016).

Source: annual reports, company presentations and analyst coverage. All information based on the last full year's results (2015 or 2016).

This shows just how effectively REA Group is able to monetize its advertiser audience in Australia. But it's not just the absolute ARPA number that is impressive, but the annual growth.

First we're going to look at ARPA growth rates among its global peers. The other major players around the world are growing nicely, with a promising uptick for Zillow Group.

 
Source: annual reports, company presentations and analyst coverage. All information based on the last full year's results (2015 or 2016).

Source: annual reports, company presentations and analyst coverage. All information based on the last full year's results (2015 or 2016).


But it's not until you add REA Group to the mix that you realise how astronomical its growth is compared to global peers. Not only is ARPA significantly larger, but it's growing at a faster pace.

 
Source: annual reports, company presentations and analyst coverage. All information based on the last full year's results (2015 or 2016).

Source: annual reports, company presentations and analyst coverage. All information based on the last full year's results (2015 or 2016).


REA Group generates more profit than any other property portal in the world. It's worth a quick shout-out to Rightmove, though, for being an incredibly efficient operation and having the highest profit margin of the major portals. Revenue per employee illustrates this perfectly.

 
Source: annual results and company presentations. Trade Me Property and Zoopla are educated guesses based on available information and the broad nature of the larger groups.

Source: annual results and company presentations. Trade Me Property and Zoopla are educated guesses based on available information and the broad nature of the larger groups.


Insight #3: Property portals are not winner-takes-all

With a clear leading portal in each market, there exists enough room and marketing spend for a viable #2 player to emerge. I've opted to look at total population below because the data is easily available. It's much more difficult to find an accurate number of transactions in each market.

Source: annual results, company presentations and Google. Axel Springer includes Germany, France and Belgium. SeLoger is not broken out separately for France, which would likely result in a much higher number.

Source: annual results, company presentations and Google. Axel Springer includes Germany, France and Belgium. SeLoger is not broken out separately for France, which would likely result in a much higher number.

REA Group and Domain are the #1 and #2 property portals in Australia, and Rightmove and Zoopla are the #1 and #2 portals in the U.K. The top portals are able to monetize between 1.8 and 2.3 times higher than the runner-up portal in each market. This is reflective of both absolute revenues as well as ARPA.

It's worth noting that Australia and New Zealand (Trade Me Property) operate in a "vendor funded" market, meaning that home sellers -- and not real estate agents -- pay for advertising on the portals.

2017 is going to be an interesting year in the property portal world. Will Zillow Group successfully turn the corner of profitability? Will REA Group's momentum in Australia continue? And how will the #2 players in each market grow?

Inside Opendoor: what two years of transactions say about their prospects


Read every analysis I've posted on Opendoor, Zillow Offers, and the iBuyer business model.

This article was co-written with Sib Mahapatra, former manager of strategy at Redfin, and now an entrepreneur and real estate tech enthusiast based in San Francisco. 

Raising $210 million is enough to get any business into the news. That’s especially true when the business in question is Opendoor, the 2-year-old real estate startup that aims to bring simplicity to the housing market by purchasing homes directly from sellers and flipping them over to buyers after a quick spruce-up.

This latest infusion of capital, announced in late November, brings Opendoor’s total war chest to $320 million. Based in San Francisco and led by CEO Eric Wu, Opendoor plans to use the capital to expand its active market presence from Phoenix and Dallas to 10 cities by the end of 2017.

Investors and stakeholders in residential real estate have eyed Opendoor with wary interest since the company was launched as “Project Homerun” in July 2014 by former PayPal exec Keith Rabois. With tons of dry powder and two years of operations in Phoenix behind it, Opendoor is building momentum: the company is already the largest brokerage in Phoenix by transaction volume.

Key questions

Now that Opendoor has a track record and a mandate to grow, it’s a good time to assess its progress to date and provide an informed perspective on the following question: is Opendoor the way forward for residential real estate? Does the Opendoor model represent a sustainable, profitable and scalable platform for reinventing how homes are bought and sold? 

Several thought-pieces have explored the pros and cons of Opendoor’s business model and its impact on the real estate industry at a high level. Our goal is to dig deeper by using public records and MLS data to shed light on Opendoor’s transaction history and inform a bottoms-up analysis of the unit economics and viability of the business. By the end of this analysis, we’ll provide answers to three questions that underlie the proposition above:

  • How much money does Opendoor make per transaction? Is Opendoor offering its customers a fair value for houses?

  • How big could this model really get in the U.S.?

  • Does Opendoor have a sustainable competitive advantage against competitors that might enter the space?

Business model

Before jumping into the overall revenue opportunity in the U.S. market, it’s worth understanding Opendoor’s business model and how it makes money. Here are the key takeaways:

  • Opendoor buys houses and owns them, acting as a middleman (as opposed to a matchmaker) in residential real estate transactions.

  • Opendoor won’t buy every house -- qualifying properties include single-family homes built after 1960 with a value between $125,000 and $500,000.

  • Opendoor makes money in two ways: from the service fees it charges, and from any difference between what it buys houses for and what it sells them for.

  • Opendoor works with real estate agents, offering to pay full buyer commissions, as well as seller commissions if a sale comes from an agent.

Opendoor charges a variable fee for its services, starting at 6 percent and rising to 12 percent for more risky properties. The average fee falls between 8 percent and 9 percent for sellers, which is higher than the standard 6 percent fee charged by traditional real estate agents. But with the higher fees come certainty around a transaction.

The customer proposition for using Opendoor is strong. For home sellers, Opendoor offers to eliminate all of the hassle and uncertainty of selling a house with a simple, transparent offer. In other words: don’t worry about fixing the fence, mowing the lawn, picking the right agent, and wondering if and when your home will finally sell. 

Opendoor takes care of it all, completing the whole process in a matter of days. In our opinion, it’s a seller experience that’s truly 10x better than the status quo.

Opendoor’s unique model lets it offer industry-leading benefits to buyers, too: 

  • All day open homes, seven days a week

  • 30-day satisfaction guarantee (if you don’t like the home, they’ll buy it back)

  • 2-year home warranty

Upside and revenue opportunity

It’s hard to argue against Opendoor’s compelling seller value proposition. But can the business make money and become profitable enough to justify its massive valuation?

First we need to understand how much money Opendoor makes on each transaction. We’re going to stay focused on revenue for the moment and not worry about costs (yet). As discussed above, Opendoor makes money from the service fees it charges, plus any difference between what it buys houses for and what it sells them for.

The analysis of average purchase value and appreciation below is based on over 350 recent listings in the Phoenix market where Opendoor bought a home, relisted it on the market, and in the case of 235 listings, eventually sold it. We also looked at over 1,500 Opendoor MLS listings throughout 2016 to get a sense of the firm's traction in Phoenix.

The chart below shows the number of sales per month in the Phoenix market over the past 20 months. As you can see, traction has increased to over 120 sales per month.

Screen Shot 2016-12-13 at 9.11.24 AM.png

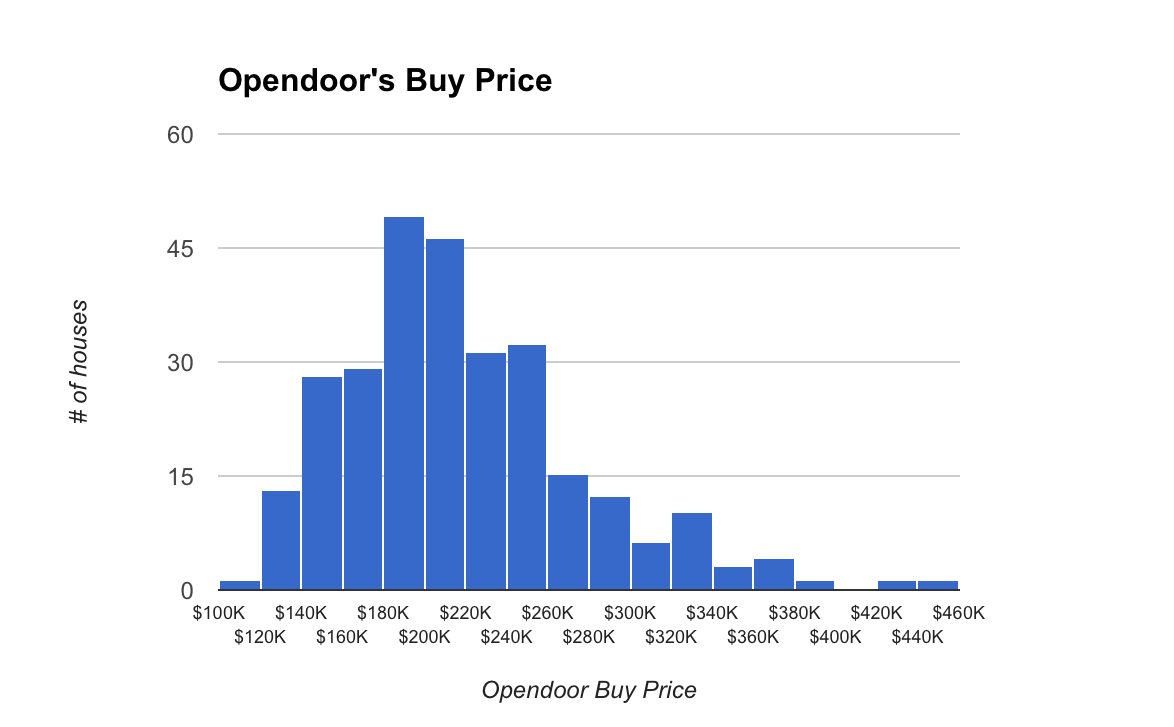
The average price paid by Opendoor for a home in Phoenix is $217,370, and is tightly clustered. Opendoor knows its sweet spot and generally sticks to it.

Screen Shot 2016-12-13 at 9.13.21 AM.png

Our analysis shows an average appreciation of 5.5 percent from the price Opendoor buys houses for and what it ends up selling them for. Again, this figure is generally well-clustered, with the few loss-making outliers offset by a few big-profit outliers.

Screen Shot 2016-12-13 at 9.14.14 AM.png

When we plug these figures into our model, we can build up a revenue estimate for the Phoenix market in 2016:


It’s possible that Opendoor books additional revenue from service fees when it buys a house, but the cash only hits its bank when a house is sold. Assuming another 400 houses in the Phoenix market that are active and will eventually sell, that’s another $7.8 million in booked revenue.

Cost and profitability

Opendoor’s seamless experience comes at a high price. By serving as an active middleman in the transaction, Opendoor effectively doubles transaction costs and incurs a wide variety of rehab and holding costs.

Below, we have done our best to estimate Opendoor’s gross profit per transaction in the Phoenix market. Again, we assume that on average Opendoor pays $217,370 for a home and charges a 9 percent fee, holds the home for 88 days, and sells it for 5.5 percent more than it paid:


Many costs are out of Opendoor’s control. For the foreseeable future, Opendoor will rely on the MLS to help it market and sell homes fast, making it tough to avoid paying the buyer agent commission. Phoenix is probably as good as it’s going to get in terms of closing costs, since it charges no transfer tax on real estate transactions.

Opendoor has more control over holding time and rehab expense. For every month Opendoor holds a home, it spends roughly $500 per $100,000 of home value. Flipping homes faster will lower the variable cost per transaction while freeing up dollars to deploy on the next purchase, reducing its effective cost of capital. By hiring in-house staff, buying supplies in bulk, and using data to identify high ROI improvements, Opendoor could shave precious basis points off the process of maximizing curb appeal. 

There are two big takeaways here. First, given the costs associated with the middle-man model, it’s tough to imagine Opendoor being price competitive with agents. The best disruptors are both better and cheaper than incumbents, and we think cost has implications for Opendoor’s addressable market. Second, our analysis shows that on average, Opendoor’s fees barely cover its costs; appreciation on the sale is critical to profitability.

Fair value for homes?

Many people question whether Opendoor is really doing what it claims: offering a fair value for the houses it buys. 

To recap: an analysis of 235 houses that Opendoor bought and eventually sold in the Phoenix market shows an average appreciation of 5.5 percent.

The analysis also shows an average of 20 days between the time Opendoor buys a house and then subsequently lists it back for sale. That gives its team three weeks to fix up and prepare a house for sale on the market. That’s a quick turnaround, and given that Opendoor generally borrows 90 percent of the purchase price and is servicing that debt, time is money!

Screen Shot 2016-12-13 at 9.15.10 AM.png

Once a home is prepped and listed for sale again, what sort of premium does Opendoor list it at? The short answer is around $20,000.

Screen Shot 2016-12-13 at 9.15.55 AM.png

There is a tight clustering right around the $20,000 mark, with an actual average of $21,570. But keep in the mind the final sales price is half of that, an average of $10,245 for our sample of 215 homes that sold.

At the end of the day, we believe it’s a fair assessment to say Opendoor offers generally fair offers for the houses they buy. It does not lowball sellers. But it does not seek the high returns that a typical home flipper would look for, only looking to recoup its investment in the property plus a small margin. (This conclusion was later validated in this extensive research study: Do iBuyers Like Opendoor and Zillow Make Fair Market Offers?)

Market opportunity

How big could Opendoor really get in the U.S. market? In order for Opendoor to reach $1 billion in annual revenues, we’d need to believe the following:

 
Screen Shot 2016-12-13 at 9.17.11 AM.png
 

The key assumption is that each new market Opendoor enters can reach the same maturity level of Phoenix. There will be overs and unders in terms of market size, average house price, and closing costs. But for a quick, back-of-the-envelope estimate, we’re keeping things simple.

While we have no certainty of what future market traction will look like, we can look at the Dallas expansion (Opendoor’s second market) for early indications. It started listing properties in August and selling in September, giving us three month's worth of data to review.

Screen Shot 2016-12-13 at 9.16.39 AM.png

The comparison above shows good traction -- just under half the volume of Phoenix in three months.

In other words, it’s not farfetched to imagine Opendoor reaching $1 billion in annual revenues. It sees its total addressable market as between 50 and 70 markets in the U.S., with plans to expand to 30 markets by 2018. Given the data we’ve seen, this is achievable. The major brakes on Opendoor’s ability to reach this scale are the availability of financing -- purchasing 30,000 houses a year would require a revolving credit line of approximately $1.5 billion, assuming its average hold period and purchase value stay the same -- and whether its automated valuation model will work well in markets that have less liquid and homogenous housing stock than Phoenix.

Risk

For investors and industry observers, the scariest part of the Opendoor model is market exposure of directly holding homes. To its credit, Opendoor clearly takes risk management seriously (it is hiring several capital markets and risk associates), and defends its robustness against market risk by making the following claims:

  • It can monitor price and market liquidity to detect a market correction early and adjust fees and home pricing, minimizing any loss.

  • As Opendoor gets bigger, it will have a more diverse portfolio of homes; all markets and asset types won’t collapse at the same time.

  • In a downturn, Opendoor doesn’t have to sell; for example, it can rent homes.

We’re most compelled by the first strategy. If Opendoor can predict a downturn before it’s widely known and shed old inventory fast with a preemptive discount, it can effectively employ a “stop-loss” mechanism that constrains the total downside. 

We are less convinced by the second and third tactics. Diversification across U.S. geographies smooths risk in placid markets, but the most recent financial crisis suggests that American real estate markets are heavily correlated during the kind of market correction that would threaten Opendoor.

Finally, Opendoor’s ability to wait out a downturn by renting homes depends on the terms of its agreement with its debt issuer. We don’t know what that agreement looks like, but it isn’t likely to be as flexible as that of a hedge fund, for example, which often benefit from flexible investment mandates and “lock-up” periods where investors can’t get their capital back. In the last crisis, banks weren’t exactly known for their patience with capital calls.

The indisputable fact is that Opendoor’s extraordinary opportunity also exposes it to deep and intrinsic risk. For the purpose of a venture investor with a five-year horizon, perhaps this doesn’t matter, but it raises questions about Opendoor’s ability to endure across economic cycles and exist as a durable franchise that permanently changes real estate. With such a thin margin, even a slight market shift could mean the difference between profit and loss.

Competitive advantage

Let’s assume that Opendoor’s model works well enough to attract the attention of potential copycats. What is the moat that will keep new entrants at bay? We’ve identified three sources of competitive advantage for Opendoor: 

  • Proprietary automated valuation model (AVM)

  • Access to capital

  • Battle-tested and efficient flip process

Ultimately, we believe a major long-term risk to Opendoor is that the key elements of its seller customer experience -- a fast and well-priced offer -- are replicable. Lack of access to capital and an accurate AVM may keep smaller aspirants out, but won’t dissuade big asset managers from entering the fray; Blackstone has directly invested in residential real estate for years. If Opendoor continues to profitably flip homes, we don’t see a compelling reason why an institutional investor with deep pockets won’t enter the market by hiring data scientists (or licensing an AVM from Redfin or CoreLogic) and undercut Opendoor by offering to beat any offer by an extra grand.

If it comes down to the highest offer, Opendoor is still well positioned to win. Its trusted brand will provide a barrier against new entrants, a better automated valuation model will let it charge less for market risk, and its experience flipping homes will pay off in lower holding costs. But victory won’t be free: we predict that competitive pressure will drive Opendoor’s unit margin below where it sits today.

Concluding thoughts

The real value of Opendoor is that it’s forcing the industry forward. The current home selling process is filled with friction, and Opendoor should be applauded for taking a gutsy approach to solving many of these pain points in a single stroke.

The data and analysis above suggests that Opendoor has a sustainable business model. It is buying and selling hundreds of homes each month with upward traction. At scale, it is reasonable to see Opendoor generating over $1 billion in annual revenues and operating profitably. Traction and market potential like that cannot be ignored.

As the first mover and brand leader in this space, Opendoor is in a strong position, but we see two roadblocks that could prevent it from succeeding at scale. The first is proving out its risk management approach to the satisfaction of lenders who will need to issue a massive amount of debt to fund tens of thousands of home purchases. The second is figuring out how to differentiate from new entrants and avoid getting dragged into a race-to-the-bottom price war that would decimate its slim margins.

Whether or not Opendoor emerges as the eventual victor in this space -- is this model definitely the next step for residential real estate? The main barrier we see is cost. Opendoor could become a very successful business by serving even a small percentage of U.S. home sellers, but its addressable market will fall short of its true potential unless it can make its service both better and more affordable than the status quo. 

A note on data: our analysis is based on MLS records, listings from Opendoor’s web site, the Maricopa City Assessor’s public property records, and public records sourced from Redfin. We used industry benchmarks to estimate the costs and fees associated with flipping homes in Phoenix. The data out is only as good as the data in, and the MLS system can be inaccurate. The analysis should be taken as such -- a review of available public records -- and not a verifiably complete picture. While absolute numbers may be off, we believe that directionally our analysis provides a very good look at the business.

Read every analysis I've posted on Opendoor, Zillow Offers, and the iBuyer business model.

At the Inman Connect Las Vegas 2019 conference, Mike DelPrete, an entrepreneur, analyst and real estate industry strategic adviser, took to the stage to explain the seismic shifts shaking up the residential real estate market.


The 2020 iBuyer Report

The iBuyer Report is a 150+ slide, evidence-based look at the world of instant home buyers. Unmatched in its breadth and depth, it explores behind-the-scenes, national data and presents an unbiased strategic analysis of the sector, the players, and the implications for the industry.


Purplebricks results show promising trends

Earlier today Purplebricks announced their interim results for the six months ended 31 October 2016. How exciting!

The chart below could effectively be called "scaling." It shows how Purplebricks managed to more than double their revenue during this time period without increasing their fixed and variable costs. While cost of sales increased linearly with revenues (think the payments to their local property experts for securing a listing), their admin expenses and sales and marketing costs stayed the same.


This shows the business model successfully scaling by reaching more customers per advertising dollar. 

You can see the equally stunning growth in listings (aka instructions aka someone paying Purplebricks to sell their home) below. 


Wow! We're talking more than doubling customers and more than doubling revenues. 

Even more so when you consider the average customer acquisition cost (how much money the business needs to spend to get a new customer). In the same period last year, that number was worryingly close to the fee Purplebricks charged customers (£849 vs. £825), making it impossible to turn a profit.

But wait, look!


Those customer acquisition costs have dropped - significantly - to around £350. That is the most interesting bit of information in this update, given it is a very robust answer to the question, "Can this model make money?"

This interim update is quite remarkable in that it shows further proof the Purplebricks business model works. While initial costs greatly exceeded revenues as the company built scale, what we're seeing now is proper scaling.

There is still the open question of how effective Purplebricks is at selling houses (as opposed to listing them), but I won't wade into that here (here's looking at you, Jefferies). But for now, I'm quite impressed with the results and what it shows for the prospects of not just Purplebricks, but the entire industry.

Note: inexplicably, many of the numbers above are not explicitly mentioned in the results. However, it's easy enough to figure out given the stated revenues, average revenues per customer, and a few assumptions.

How property portals are expanding across the value chain

full-service.jpg

Big property portals around the world have built their businesses off of advertising. Much like the classified sections in the newspapers they replaced, portals like Zillow Group in the U.S. and Rightmove in the U.K. offer the most prominent way to advertise properties for sale.

But in an effort to grow their revenue streams and provide more value to consumers, many of the portals have added other verticals in addition to advertising, looking to develop other services a home seller or homebuyer might need. They are expanding across the value chain.

As an example, one of the big areas of focus over the past few years has been valuation and data services. The first step in many home selling journeys involves a home value estimate. So, many portals have begun offering this information to consumers through automated valuation models (AVMs), a computer-generated model based on a mix of publicly available information and portals’ listing data. Zillow’s Zestimates are a good example of this.

While I was serving as head of strategy at the New Zealand property portal and classifieds site Trade Me, we invested in Homes.co.nz, in part, for this reason (I left Trade Me in January to pursue other interests after four years at the firm). Trade Me recently launched Property Insights, which offers home valuations for properties across New Zealand. It was a calculated, strategic move to expand the value offered to consumers beyond advertising and increase overall value in the market in the process.  

For this article, I look at how the big property portals in the U.S., U.K., Australia and New Zealand have expanded across the value chain. By tracking past and current trends, some commonalities emerge. Based on these, I’ll also suggest future ones.

Current verticals where portals are expanding their focus

Data and valuation verticals have been a key area for portals for the past few years. In addition to Trade Me’s efforts, Zoopla announced a partnership with property research startup Property Detective earlier this year, Zillow has had its Zestimate since 2006, and REA Group launched a tool to show estimated home values for all properties in Australia in 2015.

Home services and repairs is also a big area of focus, and potentially lucrative. Many of the big portals are making moves into this space, with marketplaces that connect tradespeople with homeowners that take a clip of the ticket along the way.

In December 2015, News Corp. (REA Group’s parent company) paid $40 million for a 25 percent stake in HiPages, an Australian online marketplace for tradespeople.

And just a few months later, Fairfax Media’s Domain Group (the No. 2 property portal in Australia) acquired a 35 percent stake in Oneflare, a similar tradesperson marketplace, for $15 million.

Antony Catalano, CEO of Domain Group, told startupdaily.net that the investment is “part of our strategy to broaden our offering to consumers and agents across the property lifecycle, into home improvement and local trade services.” It’s also a huge revenue pool, with both businesses tapping into a $100 billion local services market in Australia.

If we go back to the color-coded chart above, I wouldn’t be surprised if a few of those reds in the home services category flip to yellow or green over the next 12 months.

The rationale for expansion

At Trade Me, one reason for our desire to expand across the value chain was to extend and expand our relationship with consumers outside of the actual homebuying and selling experience. If the utility a property portal provides consumers occurs on a more regular basis, the more likely they are to come back to the portal when it’s time to sell their home and buy another one.

Growing revenues is another motivating factor when looking to expand. Many property portals see a relatively limited runway of growth in the core advertising business. Once they mature and capture a large market share, what else is there to do but slowly raise prices over time?

Expanding into adjacent services that complement the core advertising proposition makes sense. It provides consumers with more value, streamlines the entire process, and allows the property portal to tap into new revenue streams.

Another key reason for the desire to expand -- and a bit of a dirty little secret -- is that it’s exciting! If there are a bunch of Type A personalities running a property portal and setting strategy, it’s quite boring to travel the same track and look for small, incremental efficiencies. It’s sexy and exciting to try new things, especially for the types of individuals in these positions (and I’m just as guilty as the next person).

The Rightmove situation

Unless you’re color blind, you might notice that the Rightmove column in our chart is nearly all red, meaning it hasn’t expanded across the value chain. But wait, I can hear you asking, isn’t Rightmove a global leader in the property portal space?

value chain matrix 2.png

It is, and as I discussed in my previous article on the investment strategies of the major portals, it has a narrow and focused strategy on its core advertising proposition. Zoopla, the No. 2 player in the U.K. market, has the opposite strategy. It aims to be the one-stop shop for consumers, aggressively expanding across the value chain in the process.

So we have the top two players in the U.K. with completely different strategies. We should be able to see which approach is the winning one, right?

My analysis leads me to believe that Zoopla’s strategy is a result of its market position, rather than the cause of it. In other words, because Zoopla has always been the No. 2 underdog in the market with its potential of dislodging Rightmove extremely unlikely, management opted for an alternative strategy to differentiate its offering.

So, in the end there is no clear winning strategy. Or rather, both are winning strategies. But what is clear is that the big portals focus on their core proposition and completely nail it before expanding across the value chain.

Future focus areas

If I consider future trends and where the big property portals are and will be spending more effort, two emerge: the mortgage and insurance space.

Zillow Group does a great job of this with its mortgage rate comparison service, and Zoopla made a big move in the space with its £160 million acquisition of uSwitch (which has a mortgage comparison service) and its investment in startup Trussle to speed up the entire mortgage process.

These two areas represent the biggest potential revenue pools across the entire value chain. Everyone is talking about them, but not everyone is doing something in that space. It’s difficult to execute on because of the inherent complexity and well-established incumbents.

During my time at Trade Me, we launched a big effort in the insurance space with Trade Me Insurance. We partnered with an existing player in the market and worked together to launch a Trade Me-branded insurance product. It was a considerable undertaking and represents a big, long-term bet in insurance.

Where to place your bets

Another way to view the value chain is as a roulette wheel. If you’re a property portal, startup, or VC investor, where should you place your bets?

I would do three things:

  • Place the biggest, long-term bets on mortgages and insurance. It’s the biggest revenue pool and ripe for new solutions that reduce friction. Property portals are ideally placed close to the transaction where they can add real customer value.
  • Place the second-largest, short-term bets on home services and repairs. The Australian market is locked up with REA Group and Domain active in the space, but there’s still room for a big property portal tie-up in the U.S., U.K., New Zealand and Canada.
  • Stay away from other categories like moving, home inspiration, agent profiles and conveyancing. These all sit on smaller revenue pools, face strong competition from global giants (Houzz), or offer limited value to consumers from a property portal’s perspective.

Expanding across the value chain is a smart strategy that will continue in mature and emerging markets for the years to come. There will always be outliers like Rightmove, but for now, it is the exception to the rule.

Zillow Group: not quite a global leader

Many Americans, myself included, tend to think that the U.S. is the leader when it comes to online businesses. With established tech giants like Google and Microsoft and emerging players like Uber and Airbnb, they can’t be blamed for thinking the U.S. is the home of online.

But this is not the case for my area of specialisation, online property portals. The market leader in the U.S. is Zillow Group, but what may come as a surprise to many is that they are not the global leader in the space. In fact, the U.S. market is significantly behind other markets like the U.K. and Australia when it comes to business model maturity.

Comparison on a global stage

I included the following financial snapshot in my previous article on the investment and acquisition strategies of the major property portals around the world:


Subsequently, I asked the rhetorical question, “Why is Zillow so far behind in terms of profitability?” That’s exactly what I decided to take a look at today, by digging deeper into a few areas of comparison.

The profitability question

Zillow Group has the highest revenues of the major property portals around the world, but significantly lags in profitability. In fact, on a standard cash-in/cash-out basis, they are not profitable.

I prefer to look at full year results, as it’s a longer time period and presents a more complete picture than quarterly results. In 2015, its last full financial year, Zillow reported revenues of $644 million and expenses of $794 million.

In other words, they only collected $81 for every $100 spent.

Rightmove, the market leader in the U.K., collects $350 for every $100 spent. They are an exceedingly profitable business.


And I’m not just cherry picking by comparing Zillow to Rightmove. For every $100 spent, REA Group in Australia collects $266, Trade Me in New Zealand collects $277, and Zoopla in the U.K. collects $183. These are all profitable businesses that represent a positive return on investment.

So why is Zillow lagging so far behind?

Revenue growth

The U.S. market is significantly bigger than the U.K. and Australia. So perhaps Zillow is just earlier on the growth curve, right? Let’s take a look.

Again, based on the last full year’s financial results, Zillow’s pro forma revenue (which reasonably includes Trulia) grew by 18%, compared to Rightmove’s 15% and REA Group’s 17% (for their Australian operations only; total group was 20%).


So on that basis, the growth curves are not wildly different at all. But if you go more granular and dig into Zillow’s last six quarters, you get a different picture of accelerating revenue growth. The real test will be to look at their full 2016 financial results.


On a full year basis, they are basically growing at the same rate as the other big international portals. But their recent quarterly results suggest faster growth in 2016.

Employee count

Another aspect to look at is the average revenue per employee. At last count, Zillow employed around 2,500 people compared to around 400 at Rightmove. That’s about $260k/employee at Zillow compared to $600k/employee at Rightmove.

If Zillow were to achieve the same level of efficiency by doubling their revenues on the same cost basis (extremely unlikely), they would be collecting $162 for every $100 spent - a big improvement!

Monetising their customers

One last area to examine is the monthly average revenue per advertiser (ARPA) - effectively how much their customers pay for their services.

It’s difficult to get matching time periods, but here are the most recently reported ARPA numbers for Zillow, Rightmove and REA Group in the 2015/2016 timeframe. Clearly the international portals are able to better monetise their services than Zillow.


I would argue this is a factor of business model maturity. All markets have significant competitive tension. In Australia, REA Group greatly benefits from a vendor-funded marketing environment (where home sellers pay for marketing directly). But clearly Rightmove and REA Group simply have more experience and expertise around monetisation.

Followers, not leaders

It is not my intention to disparage Zillow. My point is to properly place them in a broader, international context, and acknowledge that they (and the U.S.) are not market leaders in this space.

Many people don’t realise that the U.S. is behind in the property portal space. Zillow is not on the leading edge. The clear market leaders are not in the U.S., but the U.K. and Australia, and there is a lot we can - and should - learn from them!

3 problems with VR and real estate

Last week Inman posted an article titled, “Sotheby’s International Realty beats Zillow and realtor.com to 3-D,” suggesting that Sotheby’s had somehow one-upped the top two property portals in the US with an exciting new technology.

Congratulations, Sotheby’s. You won a game that no one else was playing.

Everyone talks about the product, but there are three fundamental business issues with 3D and virtual reality in real estate that no one is talking about.

1. Agents don’t want it

Real estate agents don’t want to disintermediate themselves, and that’s exactly what this technology does. Agents want prospective buyers to contact them, ask questions about a property, and come to an open home. That’s how they get their leads!

Agents are a central part of the real estate transaction process. Why would they encourage buyers to use a technology that cuts them out of the process? High quality content like virtual reality tours empowers consumers by giving them more information about a home without the use of an agent.

There’s a fundamental issue with VR that goes against the grain of a traditional real estate agent’s job. If agents don’t want it, traction will be hamstrung.

2. Who pays for it?

VR tours and 3D models are expensive. As the article states, Matterport and other big providers charge between $100 and $200 to capture a typical home. While it’s a relatively modest fee for a $300,000 home, when you start multiplying that by hundreds or thousands of homes, it gets expensive. Fast.

There’s also a huge value misalignment. VR improves the buyer experience, but we’re asking sellers to pay for it.

So who pays for it? Buyers? Sellers? Agents? Brokerages? Property portals? Nope. No one wants to, because of the next point...

3. It won’t sell more homes

There is no convincing answer to the question, “Will VR sell more houses?” The current process works pretty well: people find a house, look at some photos, visit the property, then decide to make an offer.

Offering a virtual reality tour or interactive 3D model doesn’t change the process. The vast majority of buyers are still going to want to visit a house in person.

VR just adds another step to an already efficient process. It’s not a 10x improvement to the process of selling a house, and it won’t replace any existing parts of the process. It’s “interesting,” “neat,” and “cool,” but it’s not effective at selling more houses.

(As an aside, I believe there is very real opportunity for VR in the new developments and new construction space. In that scenario, the addition of VR adds a very real value in the process by allowing buyers to see something they previously couldn’t. It’s adding a real improvement to the process.)

The video problem

If we want to understand the potential impact of VR on real estate, we just have to look at video.

Video uptake on the big property portals is very low. REA Group in Australia has the highest numbers I’ve seen, with anywhere between 10 percent and 15 percent of listings having a video tour. But that’s the outlier.

If you look at the other big portals, like Zillow, Zoopa in the UK, or Trade Me in New Zealand, you’re lucky to find 1 percent of listings with embedded video tours. And Rightmove, the clear market leader in the UK, has basically none!

If that’s uptake for video (which has been around on our phones for a decade) - arguably a bigger bang for the value buck - what’s the hope for VR? A fraction of a fraction of a percent.

The one value of virtual reality

Sotheby’s didn’t beat anybody to anything. The big property portals around the world are more than capable of supporting features like VR and 3D. They just chose not to. Why? Because at the end of the day, VR doesn’t add enough value, faces structural impediments to widespread adoption, and is expensive.

At this point, VR in real estate is valuable only as a PR gimmick -- which worked, because I just wrote an article about it!

The 3 emerging real estate models most likely to revolutionize the industry

Read more of the extensive research and analysis I've done on the world of real estate tech.

Generally, people buy and sell houses the same today as they did 100 years ago. Aside from property portals like Rightmove, Realestate.com.au and Zillow, the industry hasn’t meaningfully shifted online. Real estate agents are front and center in the transaction, and the bulk of the process still occurs offline.

When I bought a house a few years ago in New Zealand, I used a real estate agent (I didn’t have a choice in the matter). The only way to negotiate with the sellers on price was to have the agent drive across town to my apartment with a contract, cross out the selling price with my counter-offer, and then have him drive to the sellers. This happened multiple times in a process designed to reinforce the central role of the agent. Did I mention it was 10 p.m.? Sound familiar?

The residential real estate industry is huge, and buying or selling a home is likely the biggest transaction people will make in their lifetime. So why does it feel so old? Why do we still transact properties the same way our grandparents did, with agents so dominant?

Real estate technology (also called PropTech in the U.K.) is an extremely active space with hundreds of companies around the world vying to change the industry. New models are launching on a regular basis, and investment in the space is growing.

Coming from an entrepreneurial and then corporate M&A background, I know what a successful business looks like. After founding my own gaming tech firm and selling it, I served as head of strategy at New Zealand’s leading classifieds and marketplace portal, Trade Me, for four years. I left that position in early 2016.  

From these experiences, I know that a good real estate tech company is more than fancy technology; it’s about a great product-market fit powered by a business model that works. So I set out to find out which new models were getting traction, globally.

The market landscape

There’s a lot going on in the real estate tech space. For this article, I’ve focused on one specific segment: new models changing how people buy and sell houses. I’m not covering the various tech innovations occurring in commercial real estate, rentals, tools for agents or the myriad other areas changing real estate.

Let’s set the scene. The vast majority of houses are bought and sold using real estate agents. In the U.S. and Canada, about 90 percent of transactions involve an agent, with the remainder as private sales (for sale by owner aka FSBO). The percentage of transactions involving an agent is even higher in the U.K., Australia and New Zealand.

In this article, I look at three new real estate models gaining market traction: fixed-fee operators, for-sale-by-owner services and disruptive players.

I looked for strong product-market fit and business model viability. I’m looking for businesses and business models that can materially change the way people buy and sell houses in a sustainable way, while making money. In other words, a good business.

Fixed-fee operators

These businesses operate under a simple premise: they offer their services for a fixed fee, as opposed to a typical real estate agent’s commission. The average commissions charged by an agent vary from around 1.4 percent in the U.K., 2 percent in Australia, 2.8 percent in New Zealand to 5-6 percent in the U.S.. Fixed-fee operators will typically save homesellers thousands of dollars.

The business model is straightforward. For a simple fee (typically paid upfront), the firm will list a house for sale. Advertising for properties is almost entirely done online via the major property portals. They also typically provide a yard sign. Given that a greater percentage of homebuyers now find the home they purchase from the web than from any other source, according to the 2016 National Association of Realtors profile of homebuyers and sellers, it’s logical the majority of advertising dollars shift online.

These businesses aim to offer at least the same level of service as a traditional real estate agency, and in many cases exceed it by providing services like online dashboards and 24/7 support.

The chart below shows average customer savings by using fixed-fee models. All numbers are in local currencies, and the calculations are based on average home sale prices and agent commission rates, excluding any additional marketing costs.

Aside from Purplebricks in Australia (which is an interesting outlier), the fixed-fee operators usually have a price point that saves consumers between $2,200 and $3,000.

This model is getting the most traction in the U.K., where it accounts for approximately 6 percent of the market. A half-dozen major players compete in the U.K., the leader being Purplebricks (who expanded into Australia in August 2016). Purplebricks was not the first to market when it launched in 2014, but it’s taken off like a rocket; it went public in December of 2015 and now has a market capitalization of £1.25 billion.

Purplebricks employ “Local Property Experts” -- essentially contractors paid when they secure a listing. It’s a similar model to Uber in the sense that the holding company doesn’t employ any agents directly, but pays them for completing jobs.

The consumer pays a fee of £849 upfront, no matter if the property sells or not.

Purplebricks is the clear U.K. leader because of its marketing machine. It has raised a lot of money and spent almost all of it on marketing (to the tune of £1 million per month). One of its model’s biggest challenges is the uncertainty around the unit economics, and if, when and how it will turn from negative to positive. Right now attracting each customer costs Purplebricks more than the £849 fee it collects from them.

The other issue involves how the firm pays its Local Property Experts, Purplebricks contractors who secure listings. Currently, their compensation is based on getting a listing, not on selling a property. This incentivizes them to bring in more listings and more fees, which is good for Purplebrick’s growth story to investors, but marks a disconnect with home sellers (who, of course, simply want their homes sold).

Achieving scale is the key to this model’s success. Right now the firm spends money for market share, which makes sense given the stage of the business and the wider market in the U.K. Over time, customer acquisition costs should decrease, and Purplebricks will need to raise its fees to become profitable.

Conceptually, the idea of Local Property Experts operating as contractors looks good on paper (and investment presentations), but it results in a massive incentive misalignment and churn risk. All customer interaction is through an individual outside of the company’s direct control, who can effectively come and go as they please, with variable service levels. This might work with low-cost, high-frequency transactions like car rides, but for a home sale it presents its challenges.

The best operating models I’ve seen have fully employed their sales force, with all of the resultant benefits and costs. At the end of the day it’s a better customer experience and I’d back that business 10 times out of 10.

(By way of comparison on that last point, not all fixed-fee players around the globe use contractors. There is typically a mix between salaried and contractors for the initial customer consultation, after which the customer is serviced by full-time, salaried employees.)

For sale by owner services

The for sale by owner (or FSBO for short) proposition is simple: save on commissions by selling your home without an agent. These sellers take advantage of the ubiquitous nature of property portals in their markets to advertise their property, and are willing to do everything else (open homes, negotiation, project management, paperwork, etc.) themselves. It’s a non-trivial job, but some are up for the challenge.

FSBO rates vary across mature markets, but rarely account for more than 10 percent of homes sold in any year. Rates for the U.S., Canada and New Zealand hover between 8 and 10 percent, while the U.K. and Australia rates are in the low single-digits.

The leader in this field, and who I consider to be the most successful real estate company nobody has ever heard of, is the Canadian firm ComFree. Founded in 1997, it offers to sell homes for a fee of between $600 and $1,000 Canadian, paid up front. In 2016 it listed over 40,000 properties across Canada with a market share approaching 25 percent in the province of Québec!

Its proposition can best be summed up with, “Sell your own home with our help.” It doesn’t just offer a technology solution, but empowers customers with a proven sales roadmap, tools and expertise. For instance, for an extra fee (paid only if the home sells) home sellers can hire its experts to negotiate for them.

ForSaleByOwner.com is the largest FBSO website in the US. It provides less overall customer support than ComFree, only supporting the listing process and not getting involved in the actual transaction. Its numbers suggest it facilitated roughly 10,000 sales in the past year.

The rest of the FSBO field seems to be dominated by technology startups. Homelister and HomeBay operate in the U.S.; they provide a tech product that steps home sellers through the selling process. As opposed to ComFree, they have a light customer service touch, preferring to empower consumers to own the process.

FSBO operators, especially in the U.S., typically suffer from the same fate. Most of their effort is spent developing the technology that facilitates a hands-off process for consumers. They may get decent traction with early adopters in a local launch at the city or state level, but then traction slows.

There’s only a small percentage of sellers who are comfortable selling a house on their own. The FSBO startup can appeal to those ultra cost-conscious and do-it-yourself individuals, but mass market appeal will always, I predict, lie beyond their reach.

The key success factor for FSBO companies centers on how much support it provides consumers. The winning formula that I’ve seen is, again, full-time employees with specialised expertise -- just as with fixed-fee operators. ComFree has a staff of 400 employees, making it a technology-enabled business as opposed to a pure technology company. Consumers in mature markets aren’t ready for an app to hold their hand; they still want the comforts of a human voice and human touch.

Disruptive players

I’m not a fan of the term “disruptive” to describe new players in a market coming at a problem from a different angle. It’s overused in the business world. A clown waking me up at 2 a.m. is disruptive. Is that a good thing? A business should aim to be disruptive and add value.

One of the striking observations about the residential real estate space is how few innovative businesses there are. Most real estate companies offer incremental improvements to the existing process, not a revolutionary way to do business. If you map the path from consumers wanting to sell their house to actually selling it, these firms primarily focus on optimizing the process or bringing parts of it online.

There’s only a tiny number of truly innovative companies who are remapping and reimagining the entire home selling process. My favorite, and I believe the best example, is Opendoor.

Opendoor is a San Francisco-based startup that will buy a seller’s home in a matter of days. Its proposition is ease, simplicity and certainty. The entire process of selling a house is thrown out the door: no agents, no open houses, no tidying up and fixing the fence before listing.

It’s also reimagining the entire homebuying process by providing 24/7 open homes, a 30-day money back guarantee, and a two-year warranty.

To be clear, this startup has yet to prove itself as a viable business. It’s live in three U.S. markets and has bought around 4,000 homes so far. It’s well-funded and has a great team. But only time will tell if this model resonates with enough consumers to be considered a valuable and disruptive business.

Since Opendoor’s launch and early success, a number of followers have cropped up, each with a slight twist on the model. Knock, in Atlanta, promises to sell homes in six weeks or it will buy it from the seller. Nested, in the U.K., will sell a home within 90 days or it will buy it from the seller. There’s also OfferPad, Redfin Now, and Zillow’s Instant Offers.

So who’s making money?

Traction proves a product-market fit, but at the end of the day the business must make money and turn a profit to thrive. Call me an old-fashioned M&A guy, but I like my businesses to make money.

Let’s take a look at three examples as we explore the money-making potential and viability of these new business models: ComFree, Purplebricks and Opendoor.

ComFree reported approximately $40 million in revenues in 2014, making it the largest company by revenue in my market scan. It has roughly 40,000 listings and a staff of 400.

Its prices are significantly discounted in new markets it enters in Canada. Even so, the average revenue per customer suggests it is able to successfully upsell premium services (for instance, it offers expert negotiators for an additional fee).

Earlier this year, Purplebricks reported full-year revenues of £46.7 million and pre-tax losses of £6 million. At the time, it had 450 local property expert contractors, and its numbers suggest it listed around 41,000 properties in its 2016 fiscal year.

Opendoor has claimed it has bought over 4,000 houses and averages a 9 percent commission fee (yes, you read that right: this disruptive player is charging higher fees than agents). That’s a huge potential revenue pool! On the above numbers, that’s over $75 million in potential revenues (but on very slim margins), but revenues and profitability are highly variable on eventual selling prices, costs to prepare houses for sale, debt servicing costs and the market risk associated with holding inventory (Check out my detailed analysis of Opendoor's business model, Inside Opendoor: what two years of transactions say about their prospects).

So that means the revenue potential is definitely there for Opendoor, but because of its business model design, a few more years must pass before it earns the “money-maker” designation. But it shows promise.

A note about Purplebricks

While its price point is higher than ComFree ($1,093 vs $643 in US Dollars), Purplebricks’ volumes are lower and the cost of customer acquisition is much, much higher (leading to big losses as it builds audience).

Why are customer acquisition costs so much higher for Purplebricks? Because it is relatively new in the market. ComFree has been operating for nearly 20 years in Canada, Purplebricks just two years in the U.K. One would expect (and shareholders would hope) that those costs will significantly drop over time, which is necessary for the company to reach profitability.

The most important difference between the U.K. and U.S. markets for these new models is what sellers pay for agent representation (1.4 percent in the U.K. vs. 5.5 percent in the U.S.). That difference means that operators in the U.S. are able to charge higher prices while still saving their customers money, which will make a big difference in revenue-generating potential and eventual profitability.

What we can learn

There is clearly innovation occurring in the real estate space. I’m interested in the models that are getting the most traction in the market and are making a real impact at changing how people buy and sell houses. From the scan above, some clear learnings emerge:

  • The models getting the most traction are those that smartly combine technology, human support and a killer consumer proposition. ComFree and Purplebricks have hundreds of staff to support their customers, supported by technology, and offer a compelling proposition of better service with lower cost.

  • There’s no one, winning model. All share common ingredients, but a number of different ways exist to achieve success.

  • For sale by owner propositions suffer when they focus too much on technology. The market isn’t ready for an app to sell your house.

  • There’s exciting innovation occurring with the disruptive players, but it’s too early to say if they’ll be disruptive and valuable. But watch this space.

These models aren’t going to change the industry overnight, but they do represent the best of the new models gaining traction. The future of real estate is coming -- and it will look a lot like these businesses.


The 2018 Emerging Models in Real Estate Report

A 190+ slide presentation where I take a global view of emerging models in real estate that are changing the way consumers buy and sell houses. It’s a data-heavy, representative scan of the market that pulls out facts, highlights insights, and draws conclusions.


Disruption is coming and it absolutely is Purplebricks

Last week an article was published on Realestatebusiness.com.au titled, “Disruption is coming but it ain’t Purplebricks.” The sub-headline is the attention-grabbing, “The real estate industry is set for a shake-up, but if you think it’s in the form of agencies such as Purplebricks, you are mistaken.”

The headline and the article prompted me to respond, because Purplebricks is absolutely the type of disruption that is coming to the real estate industry.

To be clear, I’m writing from a neutral position. I was previously the head of strategy at Trade Me, New Zealand’s top portal. I have no ties to Purplebricks whatsoever, but I’ve spent the past 9 months looking at new models around the world in real estate that are getting traction.

What disruption looks like

The author makes it sounds like disruption always comes in the same package: big, digital, and transformational. Uber is used as an example, and it’s a good one. Uber is incredibly disruptive! They’ve used technology - coupled with a new business model - to transform how people get from point A to point B.

But let’s not confuse a $15 cab ride with a $500,000 home sale.

These are completely different events in someone’s life, occurring at completely different frequencies and at different scales. Disruption is going to look different for each.

You can trace the concept of disruptive innovation back to Clayton Christensen’s seminal book, The Innovator’s Dilemma. The story I remember most clearly is big disruption in the steel industry, and it’s not a big, whiz-bang, transformational change. It’s about making rebar (steel bars) cheaper than the big guys. That’s where disruption starts.

Why Purplebricks is disruptive

The Purplebricks business model offers the same service as a traditional real estate agent at a fraction of the cost (roughly a 60%-70% savings). To support that model, they’re also changing the way the service is delivered, through a combination of “Local Property Experts,” technology tools, and online support.

While the jury is still out on the effectiveness of this model and if it really delivers for consumers, it is incorrect to claim that a new model changing the way real estate is transacted at a fraction of the cost isn’t disruptive.

This is what disruption looks like in real estate, and this is why everyone should be paying attention.

It’s not going to be an app to sell your home. It’s not AI, algorithms, or automation. That’s not what disruptive innovation is going to look like in real estate.

Technology might be able to radically change other businesses where the transaction costs are lower and frequency is higher, but it’s unlikely in real estate. Consumers still want a hand to hold and an expert to guide them.

Disruption is going to come from a company that offers a superior experience at a superior price. And when it comes, it will resonate with consumers and gain significant traction in the marketplace.

Purplebricks and the fixed-fee providers in the UK currently account for 5% market share. That’s tens of thousands of transactions every year - a very big deal! If you want evidence of disruption, just read about the UK’s largest estate agency closing 59 branches, or this choice quote, “The cuts come as online-focused rivals such as Purplebricks are building market share…”

If that isn’t disruption, I’m not sure what is.

Which brings me back to my point: don’t dismiss a new entrant because they don’t fit your idea of what a disruptive player looks like. Even if a new model doesn’t look like Uber, it can still shake up the incumbents.

Yes, disruption is coming to real estate. And it will look a lot like Purplebricks.

How the world’s top real estate portals think about innovation

Innovation is a tricky, vital component for every firm, and the world’s largest real estate portals are no exception.

I thought a lot about innovation during my four-year tenure as head of strategy at New Zealand’s leading property portal Trade Me. Much of my time centered on identifying and growing new ventures.

When I joined the business in 2012, it had about 300 employees. I used to say there were 299 people focused on growing the existing business and one (me) focused on growing new lines of business.

That was a big portion of my attraction to Trade Me and the role in the first place. I was intrigued by the idea of running a “conveyor belt of growth,” as the job description stated. I quickly learned that innovation at a large, publicly-traded business is vital, for reasons I didn’t fully realize until years later.

Why is innovation important?

Many assume, of course, that innovation is important at a big corporate, but rarely ask why.

The answer, in my eyes, boils down to relevance. The world moves lightning-fast; if you stand still too long, you die. Innovation isn’t a luxury; it’s standard operating procedure for any business.

But you can’t simply go to your teams, announce your intent to innovate and rejoice when the magic begins. You need to focus your efforts in the right areas, where you have a strong competitive advantage or existing network effects. In other words, areas that will naturally multiply your efforts.

For example, at Trade Me we knew when people were looking for new homes or browsing for vehicles. That was our competitive advantage. So we acquired an insurance-comparison business and launched a new insurance brand.

Innovation vs Execution

Execution is a critical component of effective innovation, a fact easily overlooked. Ideas are a dime a dozen; execution animates innovation but it’s where most companies fall down.

In a big company, new ideas come from all sources like water out of a firehose: customers, employees, market scans, books, board directors. Everyone has ideas, and they’re rarely unique.

Execution is the critical component of successful innovation. It breeds winners. Mismanaged ideas mire leaders with deadly false hopes. Those who execute on a new idea best, succeeds. It’s simple: if you want to improve innovation, focus on execution (more on this later).

The differing models of innovation

Large firms can tackle innovation in a number of ways. Below isn’t an exhaustive list, but how we thought about and considered innovation at Trade Me:

  • Run an internal skunkworks team. This is the sexiest option. Who doesn’t love the idea of a small, elite group of contributors in a dimly lit side office working on the next big thing. On the plus side, you have dedicated resources working on new, new, new all the time. On the downside -- it’s very easy to fly off the rails without proper oversight.
  • Corporate venturing. This was the strategy at Trade Me while I was there. We regularly scanned the market and made opportunistic investments and acquisitions in interesting businesses. Once we made an investment, we worked with the firm’s leaders to supercharge their company. Our big goal: make 1+1 equal 3. (Big not-so-secret secret: it doesn’t always work out.)
  • Work with local innovation aggregators. Find your local incubator or accelerator programs, scout for new opportunities and help promising startups. This can be a great place to find talented people and nurture promising ideas. This tactic marks a much earlier stage than corporate venturing and requires patience.
  • Internal hackathons. Shut your entire company down for a number of days and get everyone working on prototyping new ideas. At Trade Me, we held 24-hour hackathons twice a year. It’s a great way to get ideas flowing and increase motivation and excitement, but the outcomes are usually smaller and more incremental and can suffer without proper follow-up.
  • Nothing. Just acquire businesses or potential competitors when they get big enough. Let the market do the hard work for you by vetting new ideas, teams and execution. You’ll pay a higher price for the business, but with the higher price comes a higher certainty of success.

The challenges of corporate venturing

All big corporates face many innovation challenges. In my opinion, the biggest is always attention. How do new programs with uncertain outcomes compete against known opportunities with more certain results? As a CEO, I would much rather put my resources behind an initiative I know will pay off, rather than one that might pay off. That’s the innovator’s challenge.

Based on my experience as an entrepreneur and corporate ventures guy, I recommend segregating resources to solve this inherent perceived value disconnect.

Commit most of your resources to your existing businesses, but set aside resources, time and effort for the new stuff: 1 percent, 5 percent, 10 percent -- whatever you think makes sense for your business. Make the delineation in your mind, keep the two separate and stick with it.

One of the other big problems we faced at Trade Me was our small market. With a population of approximately 4.5 million, New Zealand has a smaller number of potential startups and entrepreneurs available, in addition to low deal flow.

The inherent challenge of working with startups narrowed our opportunities further. In my venturing, I found that startups don’t like to solve your problems; they like to solve their problems.

So what about everyone else?

When I left Trade Me in 2016, I knew deeply how we thought about innovation. But, like my interest in how other major property portals look at investments, I am intrigued by how other major portals think about innovation. How important is it to them? What processes do they have in place to efficiently execute on it?

Let’s take a look!

Innovation at three of the world’s top property portals

Trulia’s Innovation Weeks

When Zillow and Trulia combined forces in February 2015, they became the dominant real estate portal in the U.S.

Although they’re united under Zillow Group, they operate separate consumer teams. Each brand sets a week aside each quarter for innovation. Trulia calls it “Innovation Week”; Zillow calls it “Hack Week.” It’s a time for their teams to dream big and develop new products and features.

“Our culture emphasizes autonomy and innovation,” said Jeff McConathy, Trulia’s vice president of engineering. “Anyone can participate in an Innovation Week. You don’t have to be in a technical role or an engineer.”

Trulia sees this as dedicated time for all employees to experiment with new product ideas or work on pet projects they’re passionate about.

“We like to encourage employees to work with new technologies and new teammates so they can hone new skills and engage with colleagues they may not interact with on a daily basis,” Jeff said.

Each Innovation Week has a theme. When I visited earlier this year, the theme was personalization and user behavior.

The event starts the week before with a pitch party, where participants pitch their project ideas to the group. A social mixer follows to encourage team formation.

During Innovation Week, senior leaders and subject matter experts make themselves available with scheduled office hours. Trulia also trains teams on public speaking and designing pitches.

The Monday after the week of hacking -- where all participants are encouraged to put aside their normal job tasks and to avoid scheduling any unrelated meetings -- teams present their work at an event open to all in the company.

A panel of judges and the audience choose the winners. Judges pick a theme winner and the audience picks three winners: first, second and third place. The theme and first place winners work with Trulia leadership to get their ideas on the release roadmap.

Last year, teams presented more than 120 projects. Five Innovation Week projects have already shipped this year: updated Local Info PagesRent Near TransitTrulia bot for Facebook MessengerTrulia for Apple TV and Quiet Streets Map.

In addition to the week dedicated each quarter to innovation at its largest consumer brands, Zillow Group also practices a good deal of corporate venturing through acquisitions of related businesses. It also maintains strong ties with the startup community through formal relationships with two U.S. real estate tech accelerators: MetaProp NYC in New York City and Elmspring in Chicago.

Earlier this year, Zillow also hosted MetaProp’s demo day at its San Francisco offices.

REA Group’s Big Idea

Leading global digital business REA Group, parent company of Australia’s realestate.com.au, has several innovation programs.

REA Group Chief Technology Officer Tomas Varsavsky summed up his firm’s position: “We disrupted the industry 20 years ago, now we’re the incumbent to get disrupted.” Innovation is already in the DNA of the company, but its innovation programs -- it hopes -- will help it stay ahead of the curve.

Similar to Trulia and Zillow, it runs quarterly three-day hackathon events it calls “REA.io.” It encourages its employees across the globe to work on anything during these events -- even projects that aren’t directly related to the firm’s business. “It’s as much about the culture of the company as about the ideas,” Tomas said.

The firm also runs a small “Innovation Team” focused on consumer tech. It’s an internal team that plays with virtual reality, augmented reality, 3D modeling, a HoloLens, drones and more to help keep the firm on technology’s bleeding edge.

But the big idea came two years ago.

In an effort to bridge the gap between an idea that’s too big for a two-to-three-day hackathon and a business-as-usual product roadmap, it launched “The Big Idea” in May 2015.

The event starts with a company-wide call for project ideas -- typically bigger, more ambitious and more disruptive than hackdays projects. Dozens of ideas pour in not only from tech pros, but also the firm’s salespeople, marketers and those in its legal department. The firm posts those ideas for all employees to view and reviews them on a global scale. Eventually, it filters the ideas to six finalists.

REA Group then holds a “Shark Tank”-style event where the finalists pitch their ideas. The panel picks a winner (or winners) who receive $100,000 and 60 days to develop their idea into a working prototype. The company provides resources -- both internal and external -- to help the teams succeed.

The first year employees submitted over 40 ideas. This year they submitted over 60. “I was worried that we’d use up all of our good ideas the first year, but there was very little overlap and repeat ideas the second time around,” Tomas said.

For example, this year’s winner Linda Brunetti, a digital engagement consultant from REA Group’s Corporate IT team, is preparing to kick-off her project.  She’ll get support from one of REA Group’s existing lines of business, an exec-level mentor, internal IT resource, and a connection to an agency to produce a minimum viable build. In addition, she gets two months off from her day job to focus on the project.

Tomas has some advice for other companies thinking about rolling out innovation programs: “People often get caught up on the ROI of a hackday, but the culture you’re creating and the signals you’re sending companywide are just as important. Everyone is an innovator and we’re going to create space to make it happen.”

Rightmove’s Head of Innovation

Rightmove, the U.K.’s top real estate portal, is the only major portal I found with a dedicated head of innovation. A big part of Hannes Buhrmann’s job is to experiment with new consumer ideas the firm may want to implement in the near future.

To accomplish this, Hannes typically works with external teams.

“My focus is to conceptualize and validate the propositions,” Hannes said. “Sometimes that validation might consist of user research, clickable prototypes, functional prototypes and, at times, deploying fully functional features in a closed alpha or beta environment.

“When developing fully functional features, we specifically assume that the code will eventually be thrown away,” Hannes added. “This is for two main reasons: speed of development and avoidance of polishing something that may fail as a consumer proposition. The basic approach is fail as fast as possible, and as cheaply as possible.”

Hannes’ team’s inspiration for its innovation efforts include:

  • To aid Rightmove’s overall business objectives
  • To better understand the broader competitive environment (i.e. not only what other portals are doing, but also what other companies are doing within the property vertical, whether established or startups)
  • To uncover technological advances that present new opportunities for disruption

In general, the firm focuses on ideas and technologies that it can produce in the near term, not blue sky stuff.

For example, the team is currently toying with a “Where Can I afford to Live?” tool. It’s live in early alpha here (best viewed on a desktop). It’s rough around the edges and has some usability issues, but that’s the point. The goal is to get stuff out early, pull in feedback, plan next steps and release frequently.

Like the others, Rightmove also runs a hackathon event. The annual three-day event has been going for over a decade.

Making innovation work for you

While innovation is all about execution, success doesn’t happen without a smart framework to cultivate it. Like Trade Me, many of the top portals have structured programs designed to encourage innovation and build a culture of experimentation. Then they pump promising ideas through the execution engines of their larger businesses.

We held hackathons at Agora Games, the tech company I founded and ran before my time at Trade Me. It’s safe to say that the primary impetus for holding the events – and the primary outcome – was to reinforce a culture of innovation.

I’m impressed by the depth and breadth of innovation at REA Group and Zillow Group. They both run a number of different programs – from hackathons to innovation teams to a heavy involvement in the entrepreneurial scene. I’m also impressed by the massive commitment senior management at Zillow makes; one week every quarter is a big chunk of time! And given the number of projects that have launched from the event, I’d say this is a good model to follow.

A successful program requires commitment and structure.

Outside of these programs’ tangible results, the other benefits flourish. Employees receive a clear message that innovation is important. The firms maintain a vigilant eye on the future. They’re willing to make a real investment in their talent and the future of the business by supporting these programs.

When I speak to property portals from around the world about innovation, my advice boils down to three points:

  • Stay plugged in to the local entrepreneurial environment (like Zillow Group does with its strong ties to the startup community)
  • Hold structured innovation programs multiple times a year (like REA Group does with its quarterly hackathons)
  • Devote some resource – however small – to experimentation (like Hannes’ team at Rightmove)

Doing the above will keep you on the cutting edge, so you don’t get left behind.

How major property portals think about mergers and acquisitions

How do large residential real estate portals around the world think about investments and acquisitions? What types of companies do they look to acquire and how do they incorporate them?

As the head of strategy at New Zealand’s leading property portal, Trade Me, I dealt with these questions on a daily basis. I hunted for new lines of business, scoured the landscape for investment and acquisition opportunities and then executed the deals in my four years at the firm. I also developed an intense interest in how similar firms in other countries went about the same ventures.

Property portal models differ around the world, but in general they aggregate real estate information, allowing consumers to search for homes to rent and buy.

Scratching my Entrepreneurial Itch

In January, I left Trade Me and moved back to the U.S., my home country. With these questions still swirling in my head and my curiosity kindled, I decided to investigate. So I hit the road to find out how portals around the globe deal with growth, particularly around investments and acquisitions.

My journey included interviewing and studying the following portals:

  • Rightmove and Zoopla, the largest and second-largest portals in the U.K., respectively.
  • Zillow Group, the U.S.’s top player.
  • REA Group, Australia’s leading portal.
  • And, of course, Trade Me, New Zealand’s leader.
 
Based on the last full year’s reported numbers and converted to U.S. Dollars. Sources: Rightmove, Zoopla, Zillow Group, REA Group, Trade Me.*Adjusted EBITDA numbers.^It’s difficult to make apples-to-apples comparisons on portal profitability. F…

Based on the last full year’s reported numbers and converted to U.S. Dollars. Sources: Rightmove, Zoopla, Zillow Group, REA Group, Trade Me.
*Adjusted EBITDA numbers.
^It’s difficult to make apples-to-apples comparisons on portal profitability. For example, Zillow Group reports “Adjusted EBITDA Numbers” on a non-GAAP basis, which can be misleading as this article points out. Zillow's actual EBITDA result is around a $68 million dollar loss.


I hypothesized that I would find a common thread in the strategies of each firm. Surely they must evaluate investments in generally the same manner. I was excited to learn what each considered the “right way.”

The Journey

Rightmove is the leading property portal in the U.K. It reported 2015 revenues of $250.9 million and has a market cap of $5.1 billion.

The 16-year-old firm dominates the U.K. market with a massive homebuyer audience built on organic search traffic. In 2015, its site received 17.5 billion pageviews, according to the firm. It makes the bulk of its money by charging agents and developers to list homes.  

Rightmove’s mergers and acquisitions strategy sets it apart from all other major portals in the world: it simply doesn’t do them.

Instead, it focuses squarely on being the U.K.’s best place to list a home for sale. Period. It invests in that goal alone, year after year, without spending much attention on other business opportunities.

It plans to maintain that singular focus as it aims to raise the average monthly revenue per advertiser (ARPA) closer to its target of approximately £2,500, an amount consistent with newspaper advertising in 2007, the firm explained in its 2015 annual report. Its current ARPA stands at £750.

Zoopla, on the other hand, has the most aggressive M&A strategy I found among the major portals.

Driven by its entrepreneurial CEO Alex Chesterman, the U.K.’s No. 2 property portal aims to be the one-stop shop for home buyers and sellers. Its tagline could be: “Whatever you need, you can find it at Zoopla.”

The 8-year-old firm has a much smaller audience than Rightmove. Rightmove accounts for approximately three-quarters of the time consumers spend on the U.K.’s top four real estate portals, according to comScore data cited in Rightmove’s 2015 earnings report. Zoopla is second with approximately 20 percent of the attention.

London-based Zoopla has a market cap of $1.7 billion and 2015 revenues of $140.4 million.

The firm makes aggressive investments, ranging from seed investments in startups like the one it made in property repair reporting software platform Fixflo to nine-digit acquisitions of mature businesses like its purchase of the home-related services cost comparison digital platform uSwitch.

In some cases, Zoopla folds its acquisitions directly into its core business; in its smaller investments, it takes a more hands-off approach.

The U.S.’s top player, Zillow Group, is a giant. It has a market cap of $6.0 billion and reported $679.9 million in 2015 revenues.

The portal conglomerate emerged in February 2015 when Zillow -- already the market leader -- acquired its top U.S. competitor, Trulia, for $2.5 billion in stock.

The 12-year-old firm’s M&A strategy is more defined than Zoopla’s. Zillow Group only makes full acquisitions; it doesn’t bother with seed investments or minority stakes in new ventures.

It acquires businesses to build audience, plug service gaps and prepare for new opportunities in the residential real estate space. For example, it acquired two New York City portals in recent years to grow presence  in the lucrative Big Apple market: the rental site Naked Apartments for $13 million in February of this year and the portal StreetEasy for $50 million in 2013.

It’s also made big acquisitions to provide better tools to its real estate broker and agent advertisers, epitomized by its $108 million July 2015 acquisition of digital transaction management platform dotloop.

From an outside perspective, it appears Zillow Group practices a hands-off approach to managing its acquired companies.

Most brands remain intact post-acquisition. Although part of the same team and under the aegis of Zillow Group executives, the acquired firms don’t appear to experience intense corporate oversight.

REA Group, a subsidiary of global media giant News Corp, runs Australia’s dominant portal, realestate.com.au. REA Group also runs a suite of portals in other countries (see below).

REA Group has a market cap of $5.8 billion and FY2016 revenues of $488.2 million.

Portal M&A strategy
Rightmove No activity. It’s focused squarely on organically building its consumer audience.
Zoopla Aggressive and varying, ranging from seed investments in startups to full acquisitions.
Zillow Group Aggressive, but solely focused on full acquisitions to build audience and tools for its customers (agents and brokers).
REA Group Aggressive, with a strong international focus using full acquisitions to enter new markets.
Trade Me Strategic. Makes investments and acquisitions to build service offering.

Along with Rightmove, investors see REA Group as a poster child for property portal success because of its clear market-leading position and its ability to effectively monetize its agent relationships. Both businesses are cash-spinning machines.

While Zillow Group and Zoopla built audience by acquiring domestic businesses, Australia-based REA Group has an international scope. It made early plays in Europe -- Italy, Germany, France and Luxembourg -- with mixed success, and most recently took a minority stake in realtor.com operator Move Inc. in the U.S.

REA Group finalized its $414 million acquisition of Malaysian portal iProperty in 2015, giving it a strong Southeast Asia presence. Its global aims are clear.

REA Group operates real estate sites in 11 countries: Australia, Italy, Luxembourg, Germany, France, Malaysia, Singapore, Hong Kong, Macau, Indonesia and Thailand.

Trade Me operates a portfolio of classified and marketplace businesses in New Zealand, including the country’s leading residential real estate portal Trade Me Property. As a group, Trade Me has a market cap of $1.5 billion and reported FY2016 revenues of $158.7 million.

Trade Me has a flexible investment approach. In my four years there we made minority investments -- like the one we made in the data valuation company Homes.co.nz -- and outright acquisitions.

The degree to which we integrated acquired companies varied.

Based on personal experience of selling my own technology company, the video game development firm Agora Games, in 2009, I prefer to give acquisitions as much autonomy as possible. This became our default position. However, in some cases we fully integrated acquisitions into existing business units.

Because Trade Me Property dominates the New Zealand market, our M&A philosophy centered on adding more services to our offering rather than expanding audience. For example, Homes.co.nz moved us into the data and valuation space, while our 2014 acquisition of rental viewing scheduler Viewing Tracker improved our offering to property managers and tenants.

Why should we care?

After finding a new investment opportunity and presenting it to my boss at Trade Me, he would ask: “So what?” He meant, “Why should Trade Me care about this?”

The same question applies to this globe-trotting survey of portal M&A strategy.

The answer is different than the one I expected when I embarked on my journey last spring. I expected to uncover general investment themes shared by the world’s major property portals.

However, after six months of travel and dozens of interviews, I am surprised to find no commonalities among them. No two portals share the same investment approach and strategy. Each achieved massive success in its own way.

It’s clear that no one winning strategy exists.

So, if you’re looking to replicate the success achieved by these global leaders, my survey suggests it’s best to pick a path that aligns with your aptitude and vision and then execute well.

Happy hunting!