Is Compass really a tech company?

Earlier this month, The Real Deal published an excellent article about Compass. And the article included one of my favorite things: numbers.

Why it matters: Opinions aside, the latest numbers allow us to compare Compass to its peers, and really answer dual questions: Is Compass doing anything novel in the industry, and is it really a technology company?

Comparing growth rates

I'll be comparing Compass to two of its peers: Redfin and Purplebricks. Both businesses, which I know well, represent the most successful new models in real estate that are changing the way people buy and sell houses. They are successful in terms of overall revenue and transaction volumes, demonstrating market traction at scale.

Overall revenue growth for all three firms is growing impressively. It's undeniable that Compass' revenue growth is accelerating.


The core of the Compass business model is making acquisitions. Armed with $800 million in venture capital, it is aggressively buying up agents and brokerages.

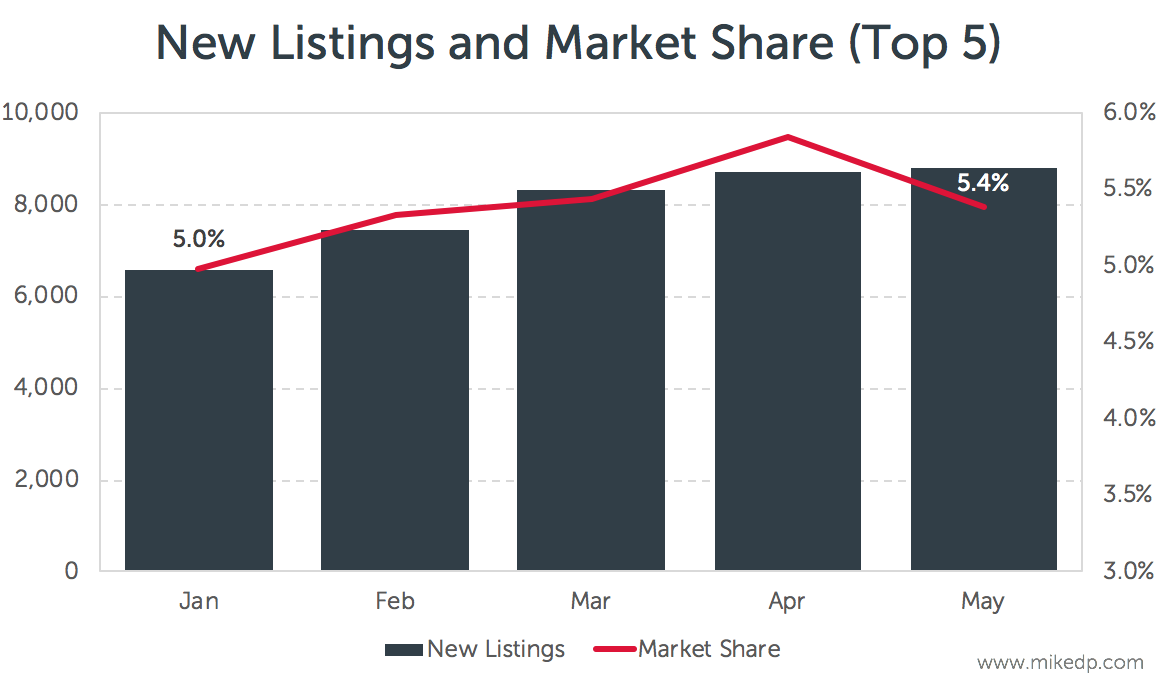
Transaction volumes are all increasing. Again, Compass' projected growth in 2018 is impressive, but that's what happens when you buy market share. By comparison, Redfin and Purplebricks are growing organically.


Is the Compass model novel?

The Compass investment thesis centers around technology. It claims that it is a tech company (with tech company valuations), and is building the "first modern real estate platform" that provides "real estate agents tools that increase efficiency."

The data has yet to prove out this thesis. Starting with another tech company, Redfin, the numbers show that it is clearly a more efficient business than Compass -- because its operating model is different.

For Compass 2018, I've included two numbers: 7,480 is the total current number of employees, while 4,800 is the midpoint between 2017 and 2018. Given that Compass is growing so quickly, it makes sense to look at both to calibrate the comparison.

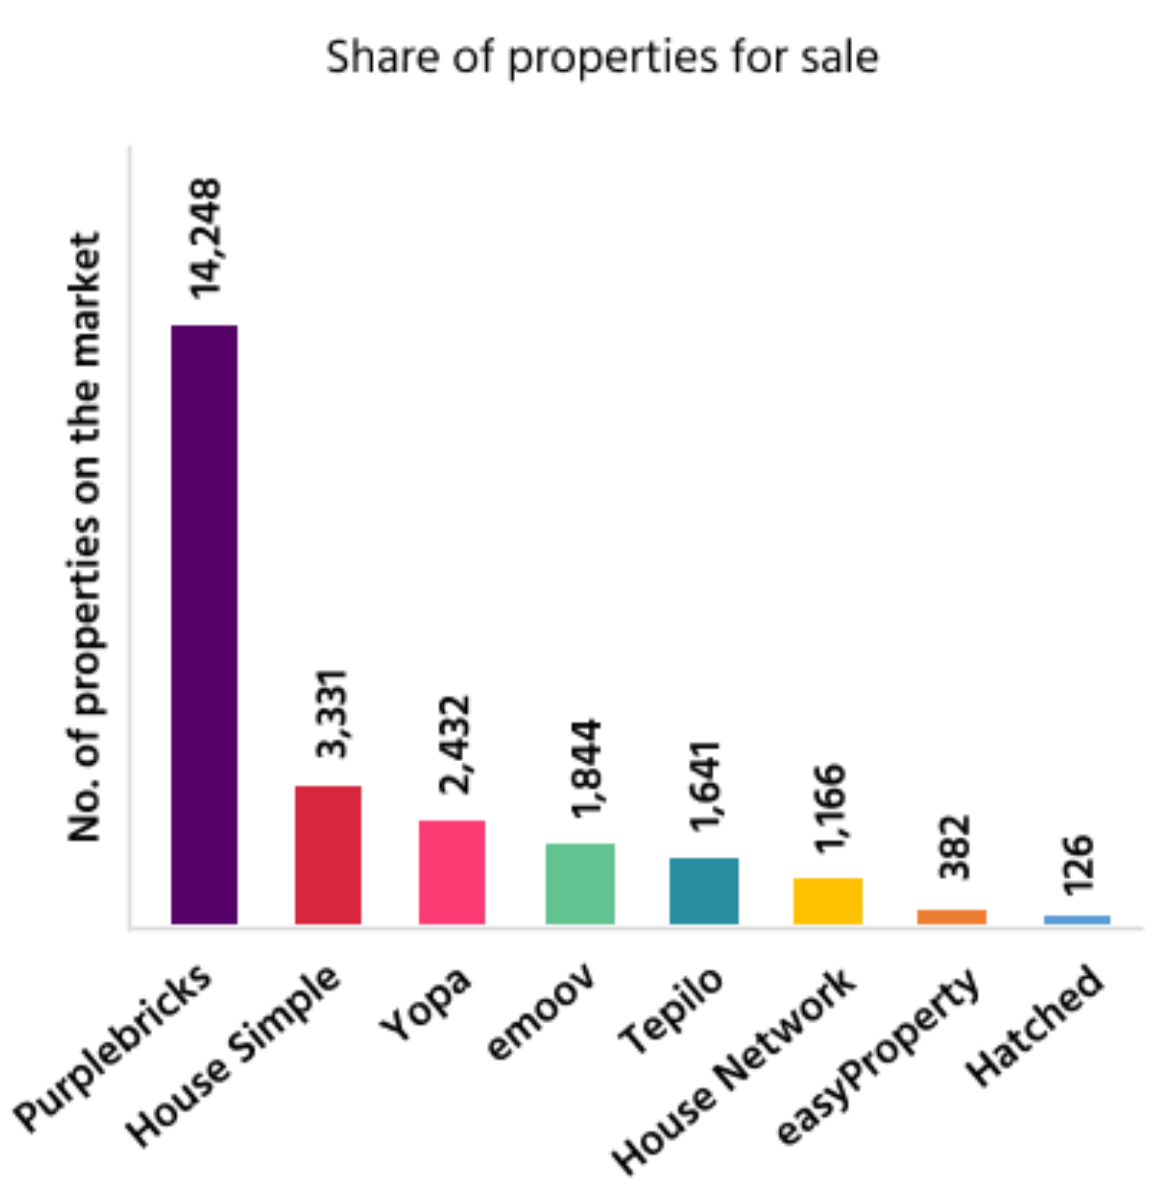
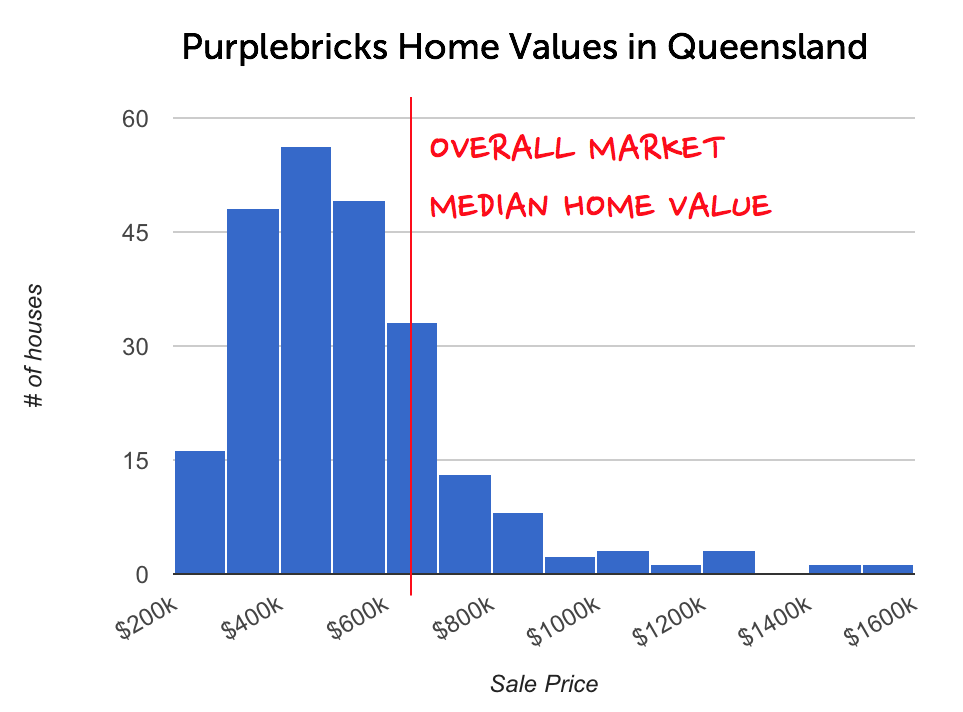
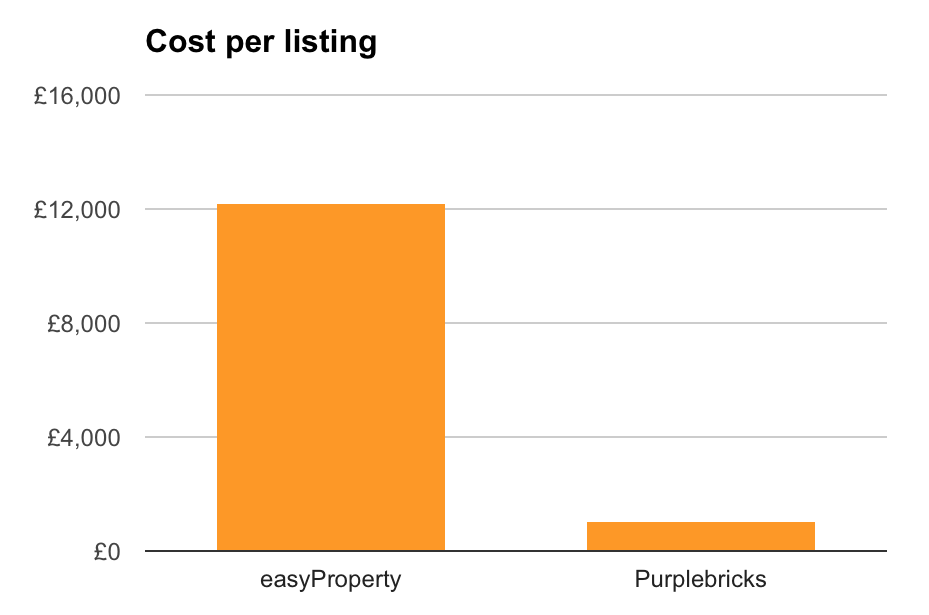
The data above is total number of employees. If we look at overall agent efficiency, as I did earlier this year when comparing Compass, Redfin, and Purplebricks in the U.K., the contrast is more pronounced.

The evidence shows that, at best, Compass agents may be incrementally more efficient than the industry average, but Redfin and Purplebricks agents are exponentially more efficient.

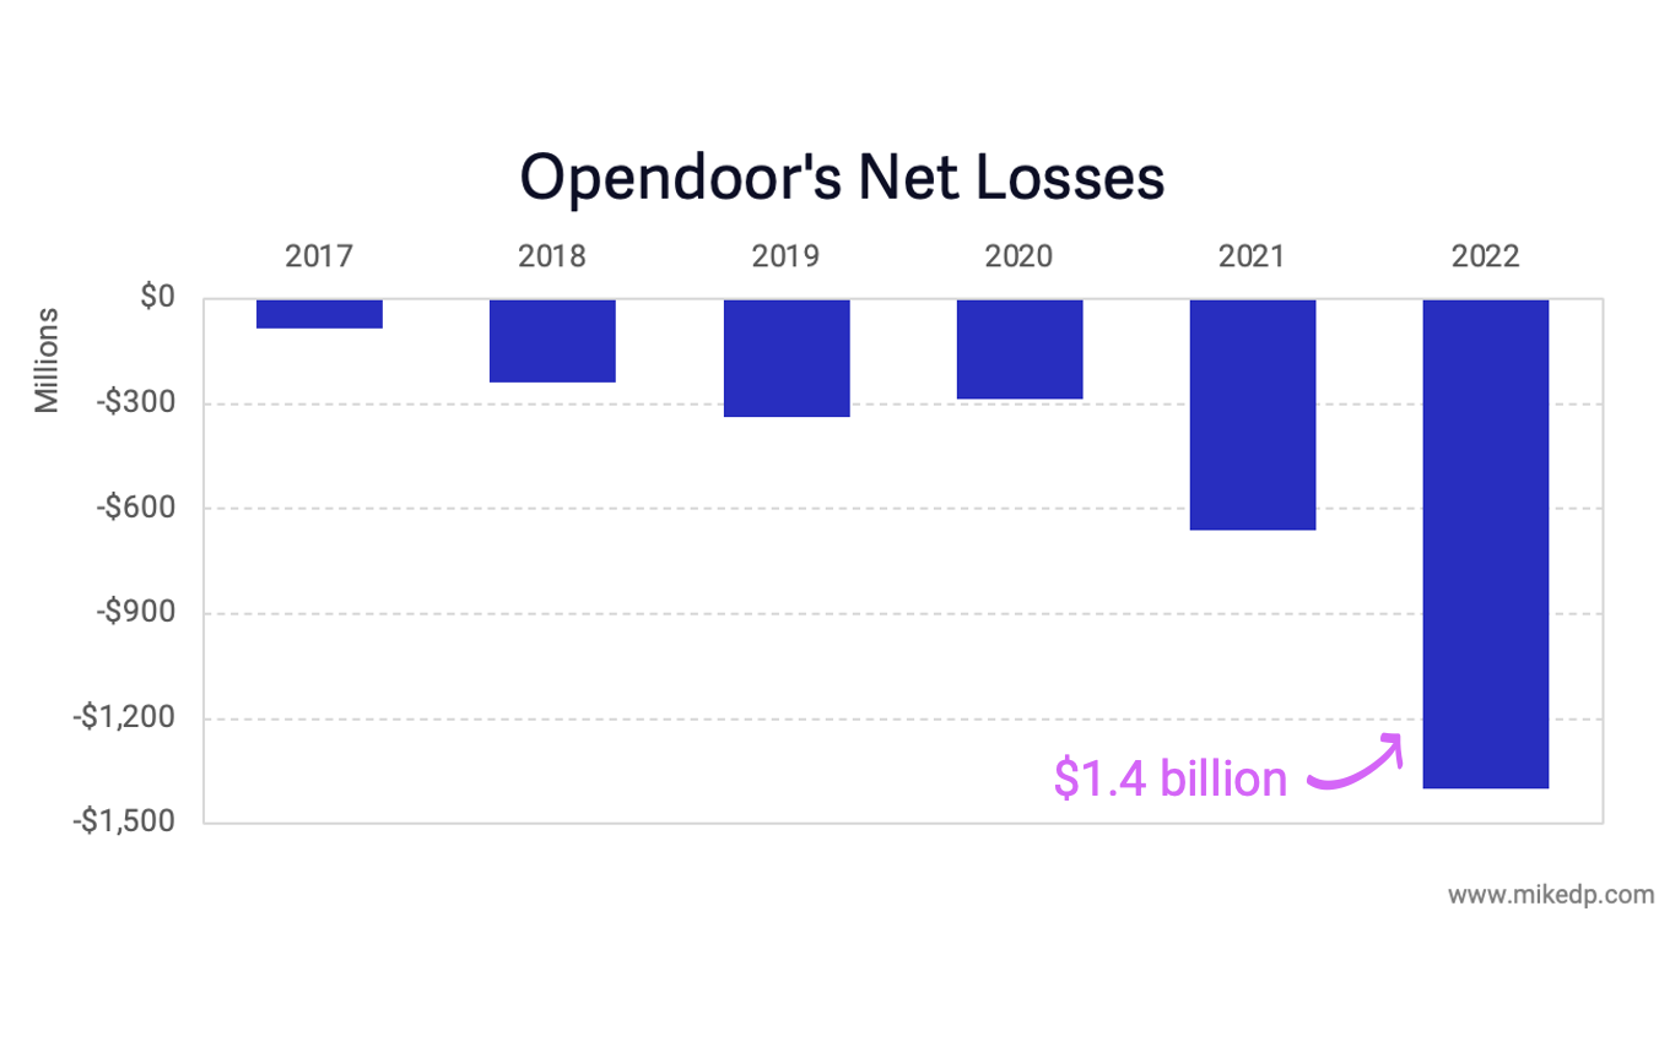
Compass' growth strategy is novel: raise a massive amount of capital and use it to acquire market share. But the operational model of the business is fundamentally the same as every other traditional brokerage -- as the data around efficiency shows. It's not really changing the industry in the same way that Redfin, Purplebricks, or Opendoor are -- it's just moving market share around.

Is Compass a technology company?

Analysis I conducted in early 2018, as part of my Emerging Models in Real Estate Report, showed that -- roughly speaking -- about 10 percent of the staff of global leaders was technical. Compass was the outlier at 4 percent.

96d595ef-5ec9-4407-be46-4a2a6a843566.png

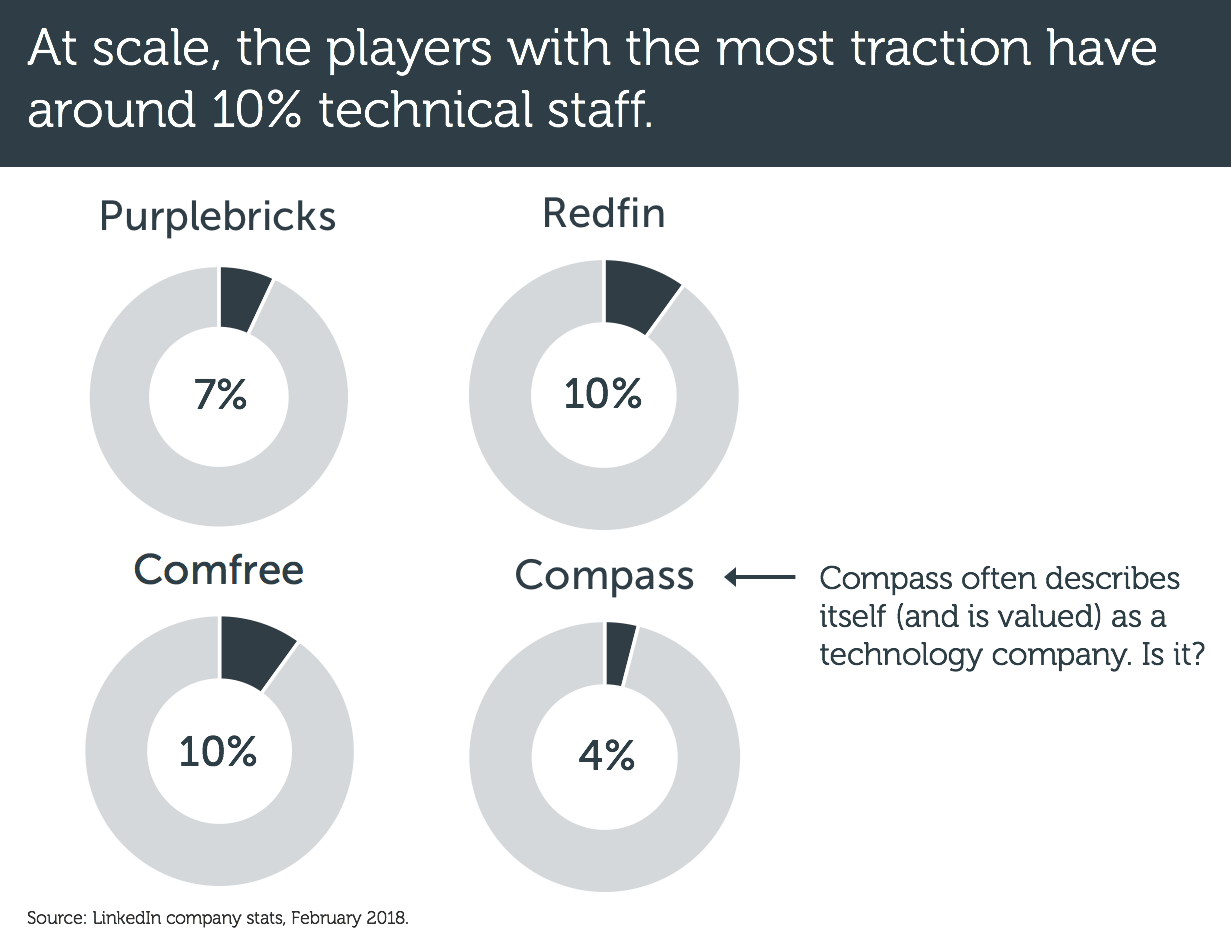
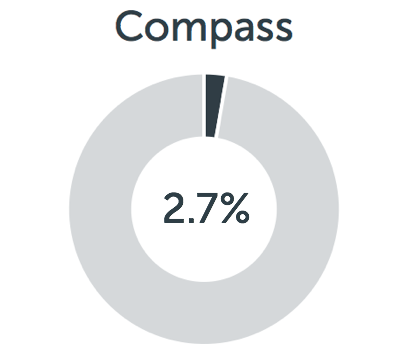
Using the latest data (7,480 total employees and a 200-person tech team), that percentage has dropped to 2.7 percent.

Even if you calibrate for Compass' fast agent employee growth through acquisition, the overall percentage is still considerably lower than its peers.

Strategic considerations

There are a few final points to consider when looking at Compass:

  • Being a tech company is not a binary thing, but what is clear is that Compass is less of a tech company than its peers.

  • As opposed to Purplebricks and Redfin, Compass' customer is the agent. The technology it is building is for agents, not consumers.

  • True, exponential efficiency gains come with technology combined with a novel operating model. Technology alone won't deliver it.


How Psychology is Holding Back Real Estate Tech

I was recently on the opening panel at Inman Connect, where the topic was the future of real estate. The conversation centered around the role of technology in the real estate transaction, and the future role of agents (watch the full video).

When I think about the modernization of the industry and technological adoption, my position is that what’s holding us back is psychology, not technology.

It's the psychology, stupid

The big U.S. real estate incumbents can’t stop talking about technology. Each week brings a new announcement about plans for new tech platforms, investments, and initiatives. And while industry gurus love to talk about the impending perfect storm of technology that will revolutionize the industry, I think they’ve got it wrong, and are repeatedly missing a key point.

That key point is human psychology, and the principle is loss aversion. In cognitive psychology and decision theory, loss aversion refers to people's tendency to prefer avoiding losses to acquiring equivalent gains: it is better to not lose $5 than to find $5. (Read more about loss aversion on Wikipedia).

In other words, consumers will prioritise avoiding costly mistakes over making (or saving) more money. 

It’s relatively easy for technology to disrupt high-frequency, low-value transactions. The risk (or potential loss) is low, both due to the small value of the transaction and the frequency with which it occurs. Think services like Uber, Airbnb, and Netflix.

On the other end of the spectrum, it is more difficult to disrupt low-frequency, high-value transactions with technology, because the potential loss from a mistake is so much greater. People typically go to specialists to help with these transactions: divorce lawyers, investment bankers, and expert consultants.

A real estate transaction, by comparison, is off the charts: it is ultra low-frequency, ultra high-value. The potential loss that occurs from making a mistake is huge.

The psychological desire to engage a specialist in these high-value transactions is loss aversion at work. People are willing to pay top dollar to secure a form of insurance on the transaction; someone to hold their hand through the process. Even when cheaper, tech-focused alternatives are available.

It's not technology holding the industry back, it’s psychology. And no software platform, artificial intelligence chatbot, or mobile app is going to change that.

The role of technology

When it comes to real estate, technology has a dual role: making agents more efficient, and providing a better customer experience. It’s not about replacing agents or removing the insurance of having a specialist involved.

This is where the incumbents — with their regular announcements of big technology plays — are at a disadvantage, and the newcomers have the advantage.

It's the businesses that are built from the ground up around efficiency that have the advantage. More efficient agents means less agents. For a big incumbent to make this change would require an entire retooling of the business, and firing a massive amount of staff and agents. It's too disruptive, and classic innovator's dilemma.

The best way to illustrate this point is agent efficiency: how many deals a typical agent closes each year.

Compass, for all its talk about using technology to make agents more efficient, has yet to demonstrate a significant impact. On the other hand, businesses built from the ground up that utilize technology to improve agent productivity are seeing dramatic gains in efficiency: a 7x improvement at Redfin and a 10x improvement at Purplebricks in the U.K. That's exponential improvement vs. incremental improvement, and is the real eye-opener in the industry.

Strategic implications

Successful new models in real estate understand the key point: smartly combine people and technology. They understand of the role of technology (efficiency and experience), and the role of psychology.

Investors and entrepreneurs assuming that tech will disrupt the real estate industry in the same way it has with low-value, high-frequency transactions are taking a myopic view. It's psychology holding us back, not technology.

If you're interested, be sure to check out the video from the full panel discussion (around 25 minutes) from Inman Connect 2018.

Analyzing Purplebricks' FY18 Results

Earlier this month, Purplebricks announced its full-year financial results for 2018, with revenues doubling to £93.7 million.

Why it matters: This is the first public glimpse into Purplebricks' U.S. launch, and across the entire group, there are a number of key takeaways:

  • The U.K. business is materially profitable.
  • The U.S. launch is very expensive, and tracking behind Australia in key metrics from the first eight months.
  • Marketing ROI in the U.K. is flat.

Coverage of Purplebricks

The media and the overall industry's response to Purplebricks' really grinds my gears.

The headlines are all negative, and revolve around "mounting losses" at the business. Some alternate -- and just-as-true -- headline suggestions:

  • Revenues double (again) at Purplebricks
  • Purplebricks' international expansion makes gains
  • Purplebricks maintains steady growth and profitability in the U.K.
unnamed.png

But none of these are as sensational -- nor do they play into the existing narrative -- of mounting losses for a doomed business.

Then you have the inevitable "the sky is falling" comment from the investment bank Jefferies, whose singular achievement has been being consistently and definitively wrong on the sector for the past three years (if you invested money on their recommendation you would have lost 88%). It's alarming that they still have enough credibility to be the go-to quotable source for these matters.

The narrative of "mounting losses"

What's most surprising about the "mounting losses" narrative is that it is unsurprising. Purplebricks recently raised £100 million from Axel Springer. The value of £1 sitting in the bank is exactly £1. Wouldn't you expect Purplebricks to spend it instead?

And like all growing businesses (the financial markets still like growth, right?), you need to spend today to make money tomorrow. The majority of growth-stage businesses are in the same boat -- which is exactly why they are raising money and spending it.

When you spend money today in an effort to grow your business, it's called investment. It's "losing money" in the same sense that you are "losing flour" when you bake bread. It's not about "mounting losses" in your flour reserves; it's about what you can make with that flour.

Materially profitable in the U.K.

Now on to the analysis! The first and most important takeaway from the results is that the U.K. business is materially profitable. The model works, it makes money, and -- at scale -- is profitable.

Whether you look at operating profit (£4.2 million), adjusted EBITDA (£8.1 million), or my preferred EBITDA with stock-based compensation added back in (£5.7 million), the business is finally generated profits after years of investment.

 
unnamed-1.png
 

The U.S. launch takes shape

The big question on everyone's mind is how the U.S. launch is tracking. Based on the numbers reported in its full-year results, Purplebricks USA generated $2.6 million in revenue from around 580 listings.

 
unnamed-2.png
 

That comes out to a hefty cost per listing of around $21,000 (compared to around $400 per listing in the U.K.). To put that in context: it's still early days so that number should be high, and, wow, that number is pretty high.

Comparing the first eight months in a new market: Australia vs. the U.S.

What I find most interesting is a direct comparison of Purplebricks' first eight months in Australia and the U.S. It's clear that Purplebricks is going big in the U.S., spending more than double what it spent for its Australian debut.


But the increased spend isn't yielding results (yet). Despite the massive spend, revenues in the U.S. are still small, with a return on investment about 1/4 of that in Australia. Remember: this is a direct comparison of the first eight months in a new market.

You're probably wondering why. It's a complex situation, but for starters Purplebricks may have launched in the wrong U.S. markets, as I've written about previously.

A few other points to note when comparing launch markets:

  • The price points are about the same: $3,200 in the U.S. compared to $3,300 USD in Australia at launch.
  • The first eight months in Australia yielded around 1,050 listings, compared to around 580 in the U.S.

One factor that's really driving costs in the U.S. is the sales and marketing spend, which is expensive in the launch markets of Los Angeles and New York City. Compared with its Australian launch, Purplebricks is spending more than double.

 
unnamed-4.png
 

Marketing ROI flat in the U.K.

One impressive aspect of the Purplebricks operation is its marketing efficiency. I've always been interested in the customer acquisition costs, as it's a critical KPI for the online agency model.

As we can see, the cost per instruction (CPI) has improved slightly from last year, but is relatively flat. (My chart is on the left, with Purplebricks' own chart on the right.)

A more granular view of the overall marketing ROI (revenue / sales and marketing) shows an overall improvement, but with a recent dip.


This is no cause for alarm. Marketing ROI is still positive and a number of factors may be at play here, including the overall housing market in the U.K. But the data does show a change from what we've seen in the past. Keep an eye on this.

Purplebricks expands to Canada in a big way

Last week, Purplebricks announced that it had acquired DuProprio/ComFree, the leading fixed-fee and for-sale-by-owner business in Canada, for £29.3 million.

Why it matters: This is a great deal for Purplebricks and further strengthens its position as the online agency leader with global ambitions.

Disclaimer: I played a small but important part in this deal, and in the past I have done strategy work with DuProprio. All information in this update is in the public domain (and sourced), and the opinions are my own.

Deal background

If you're looking at the leaders that are changing the way consumers buy and sell houses, two of the biggest global names are Purplebricks and DuProprio.

DuProprio/ComFree is one of the most successful real estate companies no one has ever heard of. I've written about the business in past. Why is it a big deal? With a model similar to Purplebricks, it lists over 40,000 properties each year (about the same number as Purplebricks last year), generates over $40 million (Canadian) in revenues, and has over 20 percent market share in Quebec (by comparison, Purplebricks has around 5 percent market share in the U.K.).

This deal represents two global leaders combining forces under one banner, and an excellent market entry into Canada for Purplebricks.

A big boost for Purplebricks

This acquisition is a big deal for Purplebricks. From a revenue standpoint, Canada immediately becomes Purplebricks' second-largest market.


That's a 25% bump in revenue from just one deal. And what a deal it was.

Deal of the year?

Purplebricks acquired DuProprio for a steal. Let me illustrate by looking at the relative enterprise value (EV) of each business compared to their revenues (source).


This is huge. The financial markets are valuing the Purplebricks business at a ratio ten times higher than the implied value of DuProprio.

In other words, when Purplebricks spent £29.3 million to acquire DuProprio, it instantly created nearly £240 million in value to shareholders (£23 million in revenues valued at Purplebricks' revenue multiple).

The big question is why DuProprio was valued so low. It was acquired by the Canadian Yellow Pages in 2015 for $50 million Canadian, and sold in 2018 for $51 million Canadian. This quote provides our only clue:

"As we continue to streamline and focus our operations, we believe the divestiture of [DuProprio/ComFree] is another very positive step for Yellow Pages and our stakeholders. Under the terms of our senior secured notes, the cash proceeds will be included in the next scheduled note redemption payment, on November 30, 2018" said the Company's Chief Executive Officer, David A. Eckert. 

DuProprio's revenues in 2014 were around $40 million Canadian (source), and Purplebricks' guidance is for around $43 million Canadian in revenues for its next financial year. So while the business has not gone backwards under Yellow Pages, growth has been muted.

Build vs. Buy

The question of build vs. buy is always top of mind when a business looks to enter a new market. Does it spend big money to launch an operation from scratch, or simply acquire an existing player?

Including Canada, Purplebricks has now entered three new markets. In the case of Australia and the U.S., it started from scratch, spending big to build market share over a number of months and years.


Based on its full-year financial results, Purplebricks spent £17.8 million to generate £2 million in revenue in the U.S. Those are expensive -- but not surprising -- start-up costs for a big new market.

Over the past 20 months in Australia, Purplebricks has spent £26 million to generate £17 million in revenues. It's taken a long time and a big investment, but that business is finally approaching breakeven.

By comparison, Purplebricks spent £29.3 million for £23 million in revenues in Canada, a materially better ROI, that took no time at all. And keep in mind that's a one-time expense; the revenues keep on coming year after year.

It's not every day an opportunity like this comes up. But given the chance, buying its way into Canada was a smart move for Purplebricks.

Strategic implications

A few key takeaways stand out from this deal:

  • Global by design. International expansion is a unique and key tenet of Purplebricks' strategy. No other company in this space (Opendoor, Redfin, Compass, Emoov, Yopa, and dozens of others) has expanded beyond one market. Purplebricks is now in four.
  • A great deal. This was a good use of capital and has manifested in a new, valuable asset for Purplebricks. Good deals like this exist in the space; you just have to know where to look.
  • Canadian growth potential. With new (and arguably better capitalized) ownership, DuProprio/ComFree is primed for growth, with Purplebricks ready to invest £15 million further into the business.

Traditional agents wade into instant offers

A Keller Williams team in Phoenix recently launched OfferDepot, an instant offer play, to "help with all the confusion with cash offers vs bringing your home to market."

Why it matters: This is the first move from a traditional real estate company into the instant offers space.

Welcome, incumbents. Seriously.

The idea that traditional real estate incumbents would enter into the iBuyer's instant offers party isn't new. Back in February, I wrote:

"...the more successful Opendoor becomes, the more of a threat they become to industry incumbents, which forces them to respond. The most logical response from a major player such as Realogy or Keller Williams would be to launch their own iBuyer program."

This isn't a top-down corporate initiative on the part of Keller Williams. Rather, this is a local team reacting to the rising interest in iBuyers and pushing to stay relevant.

The Keller Williams team isn't buying houses directly. It is collecting inbound leads from potential sellers, gathering information on the home, receiving instant offers on their behalf, and presenting everything back to the home owner (including an option to list the home on the open market) in a comparative analysis.

Why now?

We can speculate as to the reasons this Keller Williams team decoded to jump in to the fray:

  • It doesn't want to miss the boat. Whether it's Opendoor raising another $325 million or Zillow jumping in with both feet, interest in the space has never been stronger. Traditional real estate agents -- and Keller Williams -- are in the business of selling homes. Why would they let this new model pass them by? Doing nothing is not an option.

  • A one-stop-shop. It's relatively easy for traditional agents to bolt on an instant offer service, thereby turning them into a one-stop-shop for home sellers (and negating the need to contact an iBuyer like Opendoor or Offerpad).

  • Seller leads are super valuable. This is another form of lead generation for traditional agents, with each request representing a likely customer.

Implications for iBuyers

In my previous analysis, I summed up the major implications of incumbents entering the instant offer space. The first deals with the user experience:

"Make no mistake, the offer and the experience from the incumbent is going to be bad. They’re simply not set up to provide the same quality of service as Opendoor."

The online experience isn't great. In a design reminiscent of the mid- to late-90's, users must struggle through a form to submit their home's information. It's a far cry from the premium experience Opendoor strives to offer its customers through the entire process.

But it works. It does what it needs to and collects leads. And it is this dilutive effect that is the biggest implication to dedicated iBuyers like Opendoor. As I wrote in that same analysis:

"The proposition from the incumbents will be poor, but it will be enough to soak up a portion of the demand in the market and take momentum away from Opendoor and other iBuyers."

It's simple economics. If we assume the demand remains constant, the addition of supply will dilute the amount of business any one iBuyer receives.

There will also be more customer confusion as incumbents get into the game. When Opendoor was the only option in town, it was simple. But now there are a variety of choices: multiple dedicated iBuyers (Opendoor, Offerpad), a popular web portal (Zillow), a tech-enabled brokerage (Redfin Now), and a traditional real estate agent (OfferDepot). What's the difference? Who do I trust? It's difficult to explain the various propositions to consumers.

At the end of the day, that's good for traditional brokers and agents (as they can soak up additional demand), and bad for dedicated iBuyers (because of the dilutive effect and customer confusion).

Where to from here

This is just the start! Expect a lot more activity in this space by the incumbents. It's only a matter of time before a big incumbent launches a well-funded, well-designed initiative. And it may not stop at just presenting offers on an iBuyer's behalf...

Online agents consolidate in the U.K.

Two of the top runner-up online agencies in the U.K., Emoov and Tepilo, recently merged their businesses in an effort to grow market share and more effectively compete with leader Purplebricks.

Why it matters: This is the first major online agency consolidation, a natural result of unsustainable unit economics at low volumes.

Winner take most; followers fight for relevancy 

As I've highlighted in the past, the online agency sector in the U.K. is a "winner take most" market. Purplebricks, the leader, has 70%+ market share of the online agent segment.

39a135f7-f989-4de9-8324-4f7e1efc8772.png

The online agency business model only works at scale. A key hallmark of the model are low fees combined with centralized and specialized operations that process listings at an exponentially higher rate than traditional agents.

Purplebricks is profitable in the U.K.; the others are not. The unit economics are favorable at scale (thousands of listings per month), but anything less is a money-losing endeavor. Given this, industry consolidation is a natural outcome.

Runner-up spot up for grabs

As in my last analysis, using updated new listing data from Rightmove shows two clear trends:

  • The #2 spot behind Purplebricks is very much up for grabs. The combined Emoov+Tepilo entity is neck-and-neck with Yopa (in terms of new listings per month).
  • Yopa is seeing sustained, strong growth, nearly doubling its business since January.
49625871-cf75-48a3-9315-170106b032e1.png

Purplebricks is still the undisputed leader, with 5.9 times the new listings of Yopa and 7.6 times the new listings of Emoov+Tepilo for the month of May. 

It's also worth noting that Yopa is seeing strong growth since its capital raise last year. One can imagine that the business is spending big to acquire new customers, so it is unlikely to be sustainable or profitable. But it is growth nonetheless.

Total market share of the top 5 online agents is down slightly to 5.4 percent (based on new listings) in May. Post-merger, I would expect increased activity from Emoov+Tepilo that grows overall market share.

Strategic implications

This deal raises several important considerations in the online agency space:

  • Expect more industry consolidation, and for the slower horses to eventually drop out. The math is simple; the model doesn't work at low volumes.
  • Pay now vs. pay later. When considering the relative traction of Purplebricks vs. Yopa, Emoov, and Tepilo, keep in mind that all of the Purplebricks customers are committing to paying upfront; Yopa and the others offer options to defer payment until after a successful sale. In that sense, it's less surprising that Yopa is seeing such strong growth (no risk for new customers).
  • Two brands or one? Emoov has announced that it will retain both the Emoov and Tepilo brand. This may not allow the combined entity to realize the full synergy of consolidation, but we'll have to see.

Purplebricks targets mid-market America (finally)

Purplebricks launches in Phoenix and Las Vegas this week. This is on the back of its previous launches in Southern California and the New York metro area, and is the latest step in its U.S. expansion.

Why it matters: This is Purplebricks' first foray into mid-market America, the true sweet spot of its business model.

Picking the right target market

Purplebricks’ U.S. launch strategy is markedly different in terms of target markets. In the U.K. and Australia, evidence shows that the typical Purplebricks customer is at the mid-end of the market. However, the U.S. launch targeted high-end markets and customers.

In June of last year, Purplebricks CEO Michael Bruce said the average Purplebricks customer in the U.K. sold for around £240k (data on tens-of-thousands of transactions backs this up). The average house price in the UK is around £230k. 

To use Mr. Bruce’s own words, Purplebricks' success is down to "a higher concentration in the heart of the market rather than the top end where it has been extremely tough."

The story is similar in Australia. An analysis I conducted in 2017 shows similar trends in Victoria and Queensland. My analysis shows an average sale price of $415k AUD in H1 2018, below the overall market median home value.

779947e7-da69-49b5-946c-1df8ac2a942d.png

Then we come to the U.S. According to Zillow, as of January 2018 the median home price was $229k.

Los Angeles County, Purplebricks’ launch market in the U.S., has a median home price of $583k. San Diego County, one of the next launch markets, has a median home price of $540k. And Purplebricks’ latest launch market, the New York Metro area, has a median home price of $374k.

An analysis of 150 Purplebricks listings in the U.S. shows a median listing price of $552k. All of these numbers are significantly higher than the national average (in some cases, over twice as much).

Purplebricks decided to launch in U.S. markets where the median home value is more than double the national average. That’s a completely different launch strategy than its successful international markets.

It’s like taking a budget airline that caters to price-conscious families and launching a New York-to-London route for business travelers. It might not be the right fit. And for a business very much reliant on marketing spend to generate leads, it picked two of the most expensive advertising markets.

The Purplebricks proposition challenge

Purplebricks is clearly the low cost option when compared to alternatives in the U.K. But in the U.S., that's not the case.

In the U.K., the cost savings versus using a traditional estate agent are clear: on average, a home seller saves around £2,000 (outside of London and using national median home sale prices). And yes, this fee is paid upfront regardless of an eventual sale or not.

In the U.S., however, Purplebricks’ price-point puts it right in the middle of a crowded pack (and it just raised its fee from $3,200 to $3,600). It’s less expensive than a traditional listing agent. It’s slightly less or slightly more than Redfin depending on a 1 percent or 1.5 percent Redfin fee, and it’s slightly more expensive than other fixed-fee providers like Redefy and Trelora.

And that’s just the listing fee, which is paid regardless of the house selling or not. A homeseller still needs to pay a typical buyer’s agent fee of 2.5–3 percent.

In short, Purplebricks is not the clear low-price leader that it is in the U.K. There are a number of alternatives, Redfin being the biggest. And the competitive field is big, leaving Purplebricks with a relatively undifferentiated product in a crowded field (this is also true in the U.K., but the difference is that Purplebricks is already #1 in that market).

Strategic implications

There are a number of key points to consider in Purplebricks' U.S. expansion:

  • Its U.S. launch markets were not in its "sweet spot." Phoenix and Las Vegas are, which begins the true test in the U.S.
  • Advertising in L.A. and New York is expensive. Expect Purplebricks to get more bang for the buck for its advertising dollar in mid-range markets like Phoenix.
  • Purplebricks is operating in a crowded marketplace of low-cost and fixed-fee alternatives. It is not the least expensive option, and Redfin is a sizable competitor.

Online agent market share grows in the U.K.

As someone who studies new models that change the way we buy and sell houses, I'm naturally interested in the online agents in the U.K. Late last year, two raised significant money: eMoov raised £9 million in August and Yopa raised £27.6 million in September -- and it's having a noticeable effect on the market.

Mo Money Mo Listings

The charts below look at the total number of new listings for the top online agents, as recorded by Rightmove (and confirmed with data from Zoopla).

39a135f7-f989-4de9-8324-4f7e1efc8772.png

A few facts stand out:

  • Purplebricks is very much in a dominant market position.
  • Both Yopa and eMoov have seen strong gains, followed by Tepilo.
  • HouseSimple is going backwards.

If we strip away Purplebricks' numbers for a moment, the "Battle of the Rest" becomes more clear.

Yopa and eMoov raised a lot of new capital and are deploying it in sustained marketing campaigns. While Tepilo hasn't raised money, it has significantly increased its marketing spend. And HouseSimple's new CEO pulled its marketing spend before a product relaunch.

The correlation here is clear: the more money spent on marketing, the more new listings. It's not rocket science, but that's the point with this model.

If we assume the inverse is also true (the less money spent on marketing, the fewer listings), it leads to a sobering conclusion: the various propositions are undifferentiated with little organic, word-of-mouth growth, or network effects. There are no repeat customers, and the models don't "pick up steam" with more people using them (think Uber or Airbnb).

Online agents -- like traditional real estate agencies and brokerages around the world -- are expensive businesses. Investors take note: there's no secret sauce in this model that changes that equation.

Market share winners and losers

While the online agents are clearly competing with each other, the real loser in this fight is the traditional estate agent. 

The chart below shows the top online agents (Purplebricks, Yopa, Tepilo, eMoov, and HouseSimple) gaining impressive new listing volumes (up 32% from January) while also growing their collective market share of the entire market. They're not taking market share from each other; they're taking it from the incumbents.

Overall new listings market share for the online agents is up from 5.7% in January to 7.1% in April. In that same period of time, the leader Purplebricks increased its market share from 4% to 4.5%.

The time period is small -- four months -- so take it with a grain of salt. Plus these figures are based on new listings, not sales. But the story is clear: the online agent market segment is growing.

Strategic implications

There are a few salient points to consider:

  • Purplebricks is dominant. In April, it had 6.7 times the number of new listings of its nearest online competitor, and a massive 3.3 times the number of new listings of its top 4 online competitors combined.
  • Relative to the point above, scale equals efficiency (and profits). The low-cost model only works at a certain scale. Purplebricks' lead means lower expenses on a per customer basis, likely making it the only profitable online agent.
  • Money, money, money. If you want to compete in this space, you need to spend a lot on marketing. The various models are otherwise undifferentiated.
  • The market is shifting. The online players are all gaining market share, and the loser is the traditional estate agent.

The race for second place is on, with several players raising and spending tens-of-millions of pounds in the market. And there is clearly room to grow market share at the expense of traditional agents. But can they make money, or is it an expensive race to the bottom?

The Opendoor Paradox: A Strategic Analysis

86820498-41E8-44DD-A214-085C73702259.JPG

Last week I had the pleasure to visit Opendoor, the billion-dollar real estate disruptor, to give a presentation on emerging models in real estate around the globe. The presentation covered my two-year research into the winning models that are changing how houses are bought and sold.

There were some great questions from the audience, both on international models but also my thoughts on the Opendoor model itself. These thoughts, in addition to a number of recent conversations with investors interested in the space, led me to contemplate Opendoor’s future strategy and the complex competitive situation it faces.

The end result is what I call the Opendoor Paradox, and the premise is simple: the more successful the business becomes, the harder it will be to succeed.

Business model challenges

The business model of Opendoor and other iBuyers (those that buy houses directly from consumers and then sell them on) has a number of challenges:

  • An undifferentiated product. At its core, all iBuyers offer the same basic product to consumers: certainty and simplicity. There may be price competition or various technologies to support the process, but those advantages lie in the margins. The typical consumer only cares about one thing: instantly selling their house.

  • Resource intensive. The iBuyer model is expensive, and not just because it’s buying houses. To be successful, iBuyers need a lot of boots on the ground in each market they operate. These businesses are people intensive.

  • No repeat customers. This is true for all of real estate, but it doesn’t change the fact that without repeat business the cost of attracting new customers is expensive. There are no economies of scale around attracting and retaining a loyal clientele. Most importantly, this levels the playing field and reduces the barriers to entry for competitors.

Competitive tension

The U.S. is big, but for whatever reason the growing pack of iBuyers have all decided to launch in the same bunch of cities. Phoenix, Las Vegas, Atlanta, Orlando -- that’s the battleground. It’s a mess of a competitive situation where they will end up spending valuable time and resources competing against each other instead of growing the market.

 
Markets in bold have three or more active iBuyers.

Markets in bold have three or more active iBuyers.


Traditional marketplace businesses have a first-mover advantage. The first to enter a market builds brand and audience, and with each day that advantage becomes harder to overcome (network effects).

But that’s not true with iBuyers. Being first to launch in a market doesn’t necessary bestow an unfair advantage.

Because of this, it’s most likely a winner-take-most market, similar to Purplebricks and the online agencies in the U.K. With a distinct lack of network effects, an undifferentiated consumer proposition, and no customer base, you end up with a healthy competitive field that, over time, is most likely dominated by one large player.


I would expect to see more competitors launch in 2018. The market is going to get very crowded very fast. And that forms part of the paradox: the more successful Opendoor and its model becomes, the more competitors will enter the space to get a piece of the action.

The real competitive threat: incumbents

While the various iBuyers might beat each other up through tough competition in each market, that’s not the biggest competitive threat they face. The top competitive threat is the massive real estate incumbents themselves.

This forms the next part of the paradox: the more successful Opendoor becomes, the more of a threat they become to industry incumbents, which forces them to respond. The most logical response from a major player such as Realogy or Keller Williams would be to launch their own iBuyer program.

This is what Redfin has done with Redfin Now. Redfin was able to spin this test up quickly and is now able to adopt a “me too” proposition when attracting new customers. For a small amount of effort, incumbents can blunt the iBuyer proposition.

It’s a simple extension: If a consumer decides to sell their home with an incumbent, they can choose the traditional agent services for a commission, or they can sell it instantly for a fixed offer and certainty.

Make no mistake, the offer and the experience from the incumbent is going to be bad. They’re simply not set up to provide the same quality of service as Opendoor, and most likely will lowball the seller to protect their margins. But the offer will be present and it will appeal to some sellers.

The proposition from the incumbents will be poor, but it will be enough to soak up a portion of the demand in the market and take momentum away from Opendoor and other iBuyers. And if Opendoor can’t scale or if it becomes too expensive to attract new customers, it’s game over.

The more successful Opendoor becomes, the more incumbents will be forced to react, and when they do it will harm Opendoor’s growth and profitability.

Scaling challenges

Opendoor faces a number of challenges over the next 12 months. The most pressing of which is how the business scales nationally.

The previous two years have been spent proving out the model. Opendoor has been refining its processes in its two core markets, Phoenix and Dallas, trying a partnership model in Las Vegas, and just recently launched in Atlanta, Orlando, and Raleigh.

But 2018 is the big test: going national. I expect Opendoor to meaningfully be in ten markets this year. This will put a tremendous amount of pressure on the business, the management team, and the well-refined processes to see if they can all truly scale. It’s like NASA going to the moon after conducting tests in Earth’s orbit (which is exactly what they did). It’s a big step.

It will also be interesting to see how Opendoor approaches advertising. In the U.K., Purplebricks ran a national above-the-line advertising campaign (TV and radio) to build brand. That will be expensive in the U.S., but it’s a critical component to scaling the business, especially long-term customer acquisition costs. It’s also necessary to start building a moat between itself and its iBuyer competitors.

Opendoor will also face a significant challenge as it scales its people. As I mentioned above, scaling the business is resource intensive and is people dependent.

To win, Opendoor needs to provide exceptional customer service and needs to hire exceptional people. The more markets it expands to, the more people it will need. And the more people it hires, the more effort it will take to find exceptional people.

This contributes to the paradox. The larger Opendoor gets, the more difficult it will become to find quality people and maintain a high level of quality across a growing employee base -- all critical ingredients in delivering a superior customer experience.

The question of fees

Opendoor -- and its peers -- will also face ongoing challenges around its fees, both clearly explaining them to consumers and reducing them.

Opendoor needs to be price competitive with traditional real estate agents to succeed. The lower it can drop its fees, the more customers will flock its way. From the outside looking in, it appears to be doing this with the current fee structure, which happens to coincide with a noticeable uptick in activity in Q4 2017.

 
Screen Shot 2018-02-02 at 1.55.36 PM.png
 

But more fundamentally, explaining fees is complicated. The pricing charts on Opendoor and OfferPad’s websites are long and complicated, as they attempt to explain holding costs, hidden costs, and somehow compare apples to oranges. If it takes more then five seconds to explain this to someone, you’ve already lost them.

 
Screen Shot 2018-02-04 at 9.27.13 AM.png
 

Key strategic questions

Opendoor’s path forward is far from clear. As with all trailblazers, the future is uncertain, and in this case there are a number of threats. I believe the key strategic question -- and the area of utmost importance and absolute focus for Opendoor -- must be how to deliver the best experience possible to its customers.

Growth is key. Opendoor must reach scale for the business model to be sustainable and turn a meaningful profit. So it must venture forward aggressively, enter new markets, compete with fellow iBuyers, and be prepared to meet the incumbent’s threat head-on.

Opendoor must continue developing technology to automate the process (to improve efficiency) and deliver a superior customer experience (all-day open homes).

As it scales -- and because the business is so reliant on people -- it must attract and retain exceptional talent in each market it enters. This will be a key challenge, but not impossible. Maintaining a customer-focused culture with each new hire and each new contractor is easier said than done, but a critical task nonetheless.

And lastly, Opendoor must grow as efficiently as possible. It must continue reducing its fees and maintain its impressive operational efficiency. The holy grail would be combining the low-fee proposition of a Redfin or Purplebricks with the certainty of an iBuyer, but it may not be possible.

Growth comes with its own challenges and that is especially true of Opendoor. And as it grows, it will face the paradox of its greater and greater success bringing greater challenges to overcome. But only with great risk comes great reward.

The Opendoor Machine: 4 numbers you need to know


Opendoor, the real estate startup that purchases homes directly from sellers, leads the pack of a new breed of real estate tech companies. It continues to innovate and improve the experience of buying a selling a home, and as the analysis below shows, is making significant improvements to its business model as it continues to grow.

150 percent

I believe Opendoor’s ultimate metric of success is how many homes it sells. More than just buying homes (which anyone can do with enough money), the successful completion of Opendoor’s business model requires it to re-list and sell the homes it buys.

So it should come as no surprise that the first key number -- 150 percent -- is the growth in homes Opendoor has sold in 2017 compared to the same period last year. This is in its two biggest markets, Phoenix and Dallas.


The year-on-year growth is driven by Dallas, which came online in September of 2016. Entry into new markets will drive Opendoor’s overall growth. Over the same time period, Phoenix experienced a 55 percent increase in home sales.


The more recent growth in home sales has been driven by the Phoenix market, where Opendoor is selling a median average of 130 homes per month over the past three months, compared to 90 homes per month for the preceding three months.

After a big bump in Q1 of 2017, home sales in Phoenix are tracking in-line with last year.


However, there is a notable uptick in the number of homes purchased by Opendoor in recent months. Given that, we can expect a corresponding uptick in sales for the rest of the year and into early 2018.


13

This is the median average number of “prep days” between when Opendoor buys a home and subsequently lists it for sale. This is based on 50 recent transactions in Phoenix and Atlanta (where Opendoor recently launched).

Opendoor Prep Days


Impressively, this number is down from a median average of 20 days when I last did an analysis in December of 2016. That’s a 35 percent improvement! To quote that earlier analysis, “...given that Opendoor generally borrows 90 percent of the purchase price and is servicing that debt, time is money!”

That earlier analysis also predicted that a “battle-tested and efficient flip process” was one of three sources of competitive advantage for Opendoor. This improvement reflects strides made in Opendoor’s operational efficiency. It is clearly standardizing its operations and learning from past success and failures on big and small levels, to truly become a home flipping machine.

And it’s not just in Phoenix, Opendoor’s first market. It’s newest market, Atlanta, is on track just as impressively. Looking at 20 transactions shows a median average of 11 prep days. That’s a great start.

Most importantly, this shows that Opendoor’s growing operational efficiency is a transferable competitive advantage between markets. This is a critical ingredient for national expansion.

41

This is the median average number of prep days for Opendoor’s top competitor in the Phoenix market, OfferPad. This is based on a selection of transactions in July, August, and September.

It clearly shows that OfferPad is holding homes longer than its competitor -- over three times as long!

OfferPad Prep Days


In a world where time is money, this represents a significant business model and financial disadvantage for OfferPad. The longer it holds homes, the higher its holding costs.

It’s not clear what’s driving this number. Could OfferPad be spending more time and money fixing up houses before flipping them?

Regardless of the answer, the comparison of prep times between Opendoor and OfferPad illustrates stark differences in their respective business models. Opendoor aims to flip houses as quickly as possible with a super efficient process. OfferPad either has a different model, or is still working on optimizing its operations.

7.4 percent

All businesses need to make money, and Opendoor is no exception. Outside of charging homeowners a fee for its services, the second way Opendoor makes money is the difference between what it buys and sells a home for. This difference is the gross margin, and in Q3 of 2017, Opendoor’s gross margin in Phoenix was 7.4 percent.


Gross margin is a top line number (hence “gross” and not “net”), meaning it does not include the numerous costs associated with holding, repairing, and reselling a house.

What’s notable about this number is that it’s up considerably over the past year. My previous analysis in December 2016 showed a gross margin of 5.5 percent, and a comparison to Q3 2016 shows a gross margin of 5.6 percent.

This data is based on all publicly recorded transactions, so it’s not just a selection or a sample.

So Opendoor has managed to increase its gross profit on each home it sells by about 30 percent. We can speculate that this is in line with its recent strategy of lowering the fees it charges to homeowners. If it can make a bit more on each home and charge homeowners a bit less, it all evens out in the end.

Final thoughts

Working through this analysis highlighted a few key takeaways.

First off, Atlanta is off to a good start. The average number of prep days is strong and the gross margin is in-line with the more mature Phoenix market. It’s still early days, but this shows that Opendoor is able to transfer its honed operational efficiency to new markets, which is a requirement if it’s going national.

Secondly, Opendoor won’t achieve its goal of being in 10 markets by the end of 2017. Expansion is slower than originally thought. With over 100 employees in Phoenix alone, perhaps the Opendoor model is more time consuming and resource intensive than originally thought?

Lastly, and I believe most importantly, Opendoor continues to grow. The customer proposition is resonating with consumers in increasing numbers. The business model is being refined. And Opendoor is learning as it expands into new markets.

This new model of buying and selling homes is not going away. The entire industry can learn from the likes of Opendoor and the growing number of competitors that are popping up. Consumers are being increasingly drawn to new models that improve the customer experience of buying and selling a home.

A note on data: this analysis is based on MLS records, listings from Opendoor’s web site, the Maricopa City Assessor’s public property records, public records sourced from Redfin, and The Cromford Report, a specialist web-site monitoring the Greater Phoenix housing market. If you’re researching Opendoor and on the hunt for data, check out the iBuyer Analysis Pack.

Purplebricks USA: One Month In

Purplebricks, the online agent that has seen massive success while battering the incumbents in the U.K. market, launched in the U.S. about one month ago. Let’s take a deeper look at its launch, its tactics, the numbers, and its next targets.

The Model

The business model in the U.S. is similar to the U.K. and Australia (where Purplebricks also operates): Purplebricks charges a listing fee of $3,200, plus the typical compensation paid to buyer’s brokers (typically between two and three percent). Sellers must pay the fee either upfront or at closing, regardless of whether their home sells.

Purplebricks also works with homebuyers, paying a $1,000 rebate out of the buy-side commission toward closing costs.

The Customer Proposition

Pre-launch, the customer proposition for the U.S. market was the key question for me. Given that in the U.K. there are only listing agents and no buyers agents that Purplebricks needs to work with, the customer proposition is simple and straightforward: agents are bad, and Purplebricks is the alternative.

That approach would not fly in the U.S. market because it would end up alienating the industry and the important role of buyers agents in bringing prospective buyers to properties for sale.

IMG_6866.PNG

So, Purplebricks launched its U.S. campaign (check out the commercials) with a slightly diluted message focused on two key themes: saving money, and a simpler, faster process. Time will tell if the message resonates with consumers in the same, effective way it has worked successfully in the U.K. market.

Like in the U.K., the key to the model is spending big money to raise consumer awareness and generate leads. This spend is not simply online, but typically overweight with above-the-line campaigns on TV and radio. As you can see from the recruiting message below, Purplebricks are planning to spend nearly $2 million per month on advertising -- quite a large number for one market!

The Numbers

It’s only been one month. Every new business starts small, and each new real estate agency starts with one transaction. The numbers are small, but it’s important to set them as the foundation for future growth.

At the core of Purplebricks’ business are the local property agents, called Local Real Estate Experts in the U.S. After one month in the market, Purplebricks currently has 24 licensed agents operating in the launch market in Los Angeles, California. This compares to over 650 local property experts in the U.K., and over 100 in Australia.

After one month of operation, Purplebricks U.S. currently has 12 listings, nine of which are for sale, and three of which are pending. Of its 24 agents, nine agents have one active listing each. Sixteen agents currently have no listings.

Yes, in isolation 12 is a small number, but remember that this is a new business. Getting a new listing every 2.5 days isn’t bad for a new entrant in its first month. But let’s see how it grows from here.

Next Targets

What’s next for Purplebricks in its expansion across the U.S.? A Californian expansion, namely San Diego, Fresno, and Sacramento.


What to Watch?

Going forward, these are the key strategic areas to watch:

  • The numbers: listing volumes and number of agents. This is the ultimate metric to gauge whether the huge investment ($60 million) in U.S. expansion is paying off.

  • Customer proposition: keeping a close eye on the marketing message to consumers, to see if it's resonating or needs to adapt to the U.S. consumer.

It’s still very, very early days for Purplebricks in the U.S. market. But take them seriously: Purplebricks is a large, serious, international player with plenty of momentum and experience, with deep pockets. It may not revolutionize the real estate market overnight, but it will have an impact.

Transparency and bias in the face of disruption

Imagine getting an opinion on the Netflix business model from Blockbuster, or from a firm that worked closely with Blockbuster. Would there be an inherent bias, and would you trust it?

When industry incumbents are rocked by disruption, they fight back. Those who have a vested interest in the status quo will reveal their biases in an effort to fight the future and preserve the past, working to shape public opinion to their advantage.

The battleground we’re reviewing today is the U.K. real estate industry. The particular cast of characters is familiar: Countrywide, the incumbent; Purplebricks, the disruptor, and Jefferies, the investment bank in the middle.

Investment banks and transparency

This article centers on Jefferies, a well-respected investment banking firm that, among other things, provides deep industry knowledge across a number of sectors to investors.

The firm often pops up in media coverage of Purplebricks, the disruptive online estate agency, due to its coverage of the business. Its first detailed analysis of Purplebricks pulls no punches with this opening:

“Whether people buy or sell their homes through Purplebricks, we don't recommend that they buy shares in the company. The numbers in the business model look very attractive, however it is our view that they don’t add up.”

Purplebricks is commonly viewed as the top competitor to Countrywide. Its rise in market share and market cap coincides with the decline at Countrywide (for more, see Traditional vs Tech: How the U.K.’s biggest real estate incumbent is reacting to digital disruption).

When Jefferies is quoted about Purplebricks in the media, it is usually critical, ranging from a blistering attack on Purplebricks’ sales performance and finances to suggesting Purplebricks should be viewed as more of a gamble than a property services firm.

Jefferies also puts out deep analysis notes on particular businesses with recommendations to buy, hold, or sell that business’s stock. Here’s the one that kicked off its coverage of Countrywide in 2013.

Interestingly, Jefferies counts Countrywide, the largest estate agency group in the U.K., as a corporate client; it was named sole broker to Countrywide in June 2013, soon after the firm was refloated by its private equity owners. This fact is never mentioned in any media coverage of Jefferies’ thoughts on Purplebricks, and is contained in the fine print in its reports (page 113 of 117 in the Countrywide report linked above).

This type of conflict of interest is not unique to Jefferies and is well understood (and regulated) in the finance industry. Firms such as Jefferies are legally required to declare any potential conflicts of interest, especially when reports and recommendations are issued for corporate clients.

The potential and reality of bias is well documented across numerous research papers. In “Inside the 'Black Box' of Sell-Side Financial Analysts,” the authors sum up their findings:

“Whereas issuing earnings forecasts and stock recommendations that are well below the consensus increases analysts’ credibility with investing clients, it can also damage analysts’ relationships with managers of the firms they follow.”

And in “Conflict of Interest and the Credibility of Underwriter Analyst Recommendations,” the researchers conclude that:

“ … Stocks that underwriter analysts recommend perform more poorly than “buy” recommendations by unaffiliated brokers prior to, at the time of, and subsequent to the recommendation date. We conclude that the recommendations by underwriter analysts show significant evidence of bias. We show also that the market does not recognize the full extent of this bias.”

Stock recommendations

One way an investment bank or broker provides value to investors is by issuing stock recommendations. These typically come in three flavors: buy, hold, or sell.

The following chart summarizes Jefferies’ stock recommendations in the real estate field for three-and-a-half years between August 2013 and March 2017. The three corporate clients of Jefferies (Countrywide, LSL, and Zoopla) are listed on the left, and three direct competitors of those clients are listed on the right (Rightmove, Foxtons, and Purplebricks). This chart plots the total duration of the recommendations in days. The results are illuminating.

Screen Shot 2017-08-21 at 9.11.02 AM.png

Jefferies issued twenty separate “buy” recommendations for its corporate clients, spanning over 2,000 days, while issuing none for their direct competitors. It issued five separate “sell / underperform” recommendations that spanned 700 days for direct competitors of its corporate clients.

Meanwhile, the sustained positive stock recommendations for Countrywide and LSL corresponded with massive underperformance (a 71 percent and 52 percent drop in stock price), while the negative stock recommendations for Rightmove and Purplebricks corresponded with a big gain in stock price (60 percent and 88 percent respectively). Investors would have lost a lot of money if they had heeded Jefferies’ advice.

The data, pulled directly from Jefferies and covering 38 data points over that three-and-a-half year period, raises questions about whether Jefferies favors its corporate clients and may indeed be biased in its research.

Jefferies’ recommendations in a wider context

To further understand Jefferies’ position on Countrywide, I’ve added a time-based dimension. The following analysis focuses on a key period between March 2015 and June 2016. It was during this defining 15 months that Countrywide’s prospects slanted noticeably downward while Purplebricks continued to grow and floated on the London Stock Exchange.

The chart below highlights that period of time with the stock recommendations of Jefferies (in red) and seven other investment banks and brokers (in dark blue): Goldman Sachs, Credit Suisse, Panmure Gordon, Numis, Citigroup, Peel Hunt, and Barclays. (The data sourced for these other brokers is from Broker Forecasts and may be incomplete, but tells a clear story).

Countrywide Stock Performance (2013 - 2017)

Screen Shot 2017-08-21 at 9.04.08 AM.png

During this 15-month period, Jefferies made or reiterated a buy position on Countrywide on five separate occasions.

Citigroup was the only other broker to issue a buy recommendation during this period, but only maintained it for one month. For the other brokers, there were a total of three downgrades and one upgrade (from sell to hold).

While Jefferies maintained a positive outlook on Countrywide during a challenging period, the peer group of investment banks and brokers clearly saw things differently. While seven brokers maintained hold recommendations, Jefferies stands out as the only broker to maintain a positive buy rating during this time -- over 15 critical months.

Why we should care

Everyone has biases. Even Jefferies addresses this in its reports:

“Jefferies does and seeks to do business with companies covered in its research reports. As a result, investors should be aware that Jefferies may have a conflict of interest that could affect the objectivity of this report.”

There’s a reason banking firms are heavily regulated and legally required to highlight potential conflicts of interest: transparency. Whether it’s an investor looking for stock advice, a consumer reading the news, or a homeowner considering options to sell their home, they deserve transparency.

Jefferies is often at the center of debates around Purplebricks, with its detailed analysis and public opinions, and is presented as a knowledgeable and objective source. What my analysis shines a light on is not Jefferies’ knowledge of the real estate space (its analysis is comprehensive), but rather its objectivity.

Objectivity is especially important for new, disruptive business models. When evaluating new businesses, the public deserves to be fully aware of where they get their information from. Even seemingly objective sources may be biased.

Jefferies declined to comment for this article.

Stock charts courtesy the wonderful Financial Times and stock recommendations pulled from Broker Forecasts. My own personal bias is towards truth and transparency. Neither myself nor any associated entities have any business relationships with any firms mentioned in this article.


Purplebricks shows good momentum in Australia; appeals towards lower end of market

Purplebricks launched in Australia in August 2016. Last week's trading update piqued my interest in its market traction in Australia, which led to several interesting observations. All data is publicly available from the top property portal in Australia, realestate.com.au.

To begin, let's look at overall market traction. The chart below shows the number of houses sold each month (as reported on the portal).


There is clear, continued growth in its two launch markets, while NSW is off to a promising start. The overall numbers are still low, but there's a promising and unmistakable upward trend in all markets.

Purplebricks currently list 26 LPEs (Local Property Experts) in Queensland, 20 in Victoria, and 12 in NSW. Given the monthly sales figures above, we can calculate an approximation of many properties each LPE is selling per month.


NSW is quite new, so it makes sense that the ratio is lowest there. But in the two, slightly more mature markets, you can see that each LPE is selling between two and two-and-a-half properties each month.

At the time of writing, there are 346 properties listed for sale in Queensland, 196 in Victoria, and 83 in NSW. Given the same LPE numbers, we can plot out the total number of current listings relative to LPEs.


There are a number of factors that could influence these numbers. It could be a reflection of average time on market; perhaps there are more listings per LPE in Queensland because it takes longer for properties to sell. Or it could be a reflection of timing; it may take several weeks for a new LPE in NSW to become fully productive with acquiring new listings.

The real magic will be in seeing how these ratios change over time, so stay tuned!

Looking at the listed sale prices of just under 500 properties gives us a look at what segment of the market the Purplebricks proposition appeals to. The chart below shows clear clustering in Queensland, where Purplebrick's median sale price is $493,000, below the overall market median home value of $655,000.

 
Screen Shot 2017-05-15 at 1.02.51 PM.png
 

Likewise, sale prices in Victoria are also well clustered around a slightly higher median sale price of $530,000, compared to the overall market median home value of $826,000.


As is clearly evident from the two charts above, the median home values in both Queensland and Victoria are higher than Purplebricks' median sale price. A reasonable conclusion would be that the Purplebricks offering and proposition currently appeals to the (slightly) lower end of the market in Australia.


Is it true that owners with high value homes are still more comfortable using a traditional real estate agent (even though they could proportionally save more on commissions by using a service such as Purplebricks), or is it still early days with Purplebricks building trust in a new market?

Regardless, it's clear that the proposition is resonating with a growing number of consumers. Next stop: The U.S. market.

Traditional vs Tech: How the U.K.’s biggest real estate incumbent is reacting to digital disruption

Written in collaboration with Eddie Holmes, partner at PropTech Consult.

It’s indisputable that digital transformation is occurring in real estate and changing the way people buy and sell houses. Nowhere around the world is this more evident than in the U.K., where upstart online agencies like Purplebricks have captured market share and are growing fast.

Often, we spend most of our time looking at the disruptors. But for every disrupter, there are those being disrupted. In this case that’s Countrywide, the U.K.’s largest estate agency group.

Countrywide’s stock price is down over 50 percent during the past 12 months, shedding hundreds of millions of pounds in value.

But the firm hasn’t stayed still; in 2016 it launched its own online offering, which is now rolling out across its massive network. But while credit should be given for moving early and quickly, Countrywide’s strategy raises serious questions around the viability of the offering and if it was, in fact, designed to fail.

Background

Countrywide is the largest estate agency group in the U.K. Founded in 1986 following the acquisition of two estate agencies by Hambros, the company grew through sustained acquisitions of businesses such as Nationwide and John D Wood estate agents.

Today it employs 11,300 personnel across 1,500 branches under 47 high street brands.

Trading as a property services business, rather than simply an estate agency, Countrywide provides a range of services to homebuyers, sellers, renters and landlords.

Countrywide has been the hardest hit estate agency incumbent in the U.K.

The perfect storm of macro economic factors affecting the housing market combined with the rising competition from online agencies has brought immense pressure on its business.

This has come about in the context of an organization that was not known for the robustness or depth of their technology systems before the market dynamics changed.

Purplebricks is the largest of a new breed of online agencies. Its proposition to homeowners is a low, fixed-fee, combined with smart technology to save consumers thousands of pounds when selling their home.

Together, these firms have captured 6 percent of the market in the U.K., and continue to grow.

To illustrate their different fortunes and trajectories, the chart below shows share price changes over the past 16 months for Countrywide (orange) and Purplebricks (blue):

Countrywide’s stock price has taken a hammering. Meanwhile, Purplebricks’ market cap is greater than the two largest listed estate agency groups in the U.K. combined, showing a clear picture of where the investment community sees the future of the industry.

If the investment community was bearish on the entire real estate market, Purplebricks’ market cap would be much lower. But the reality of the markets shows a clear preference toward where the future lies.

This market pressure is affecting all estate agency groups in the U.K. The chart below shows how three of the largest players have seen their revenues and profits impacted over the past 12 months. Countrywide is not alone, but it has been the hardest hit:

We’re at a pivotal point for the entire industry and for Countrywide in particular. This is a business in decline, and the line between death spiral and a rebirth is razor thin. The chart below shows the Countrywide story as only numbers can do: flat revenues and decimated profits.

Anthony Codling, an analyst at the investment banking group Jefferies — which has previously acted for Countrywide — sums up his position: “Although Countrywide may be down, it is not out and if what doesn’t kill us makes us stronger, we expect the group to emerge strongly from the storm once it has run its course.”

But it is still unknown if this will kill Countrywide. Only time — and its strategy to combat the rising tide of online agencies — will tell.

Countrywide reacts

Countrywide’s strategy became clear in 2015 and has two main pillars under the title “Building Our Future.”

  • Launch an online hybrid competitor of its own (the multichannel approach)
  • Rationalize the existing business by closing branches and consolidating brands

These efforts resulted in the pilot launch of its new, online offering in May 2016, and the closing of 200 branches and four brands in 2016 (leaving Countrywide with 991 branches and 47 brands).

The restructuring of its business didn’t come cheap; £8.1 million of redundancy costs and £15.8 million of property closure costs, plus a £19.6 million goodwill impairment charge.

The investment in the new technology platform was an outsourced build, rumored to cost an additional £6 million, while salary expenses for the year increased £6 million to £366 million.

Clearly, Countrywide is spending significant cash and investing in both pillars of the strategy. It has also executed both pillars simultaneously, which must have caused significant cultural challenges among the workforce at a time when laser focus on the online pilot — instead of restructuring — was critical.

An inconclusive pilot

Countrywide sensibly rolled out its new online offering across three test markets. This allowed it to get to market fast, collect real customer feedback, and (we assume) incorporate that feedback back into the product.

The data below tracks Countrywide’s daily listings via the three brands used to pilot the scheme and shows that overall listings are down versus the previous pre-pilot performance:

Systemic issues with the offering

Countrywide ran its pilot and subsequently launched its online offering under its existing brands and corporate structure. It is positioned as an additional service, rather than as a separate offering, as evidenced from the messaging below.

This means that the new offering — which is being offered at a fraction of the cost of existing services — is operating within the same cost structure, making it difficult to turn a profit.

Marketing this service under the existing Countrywide brands and utilizing existing marketing channels (in the case above, the Entwistle Green website) raises some questions about the purpose of the service.

It is widely accepted that tech-driven businesses typically acquire newcustomers in new ways when compared to their traditional business competitors (for example, through smart digital marketing).

The ultimate goal of pushing services through new channels is to achieve an element of virality in the spread of the product, which reduces the cost of customer acquisition and creates the opportunity for larger profit margins.

However, by using traditional marketing channels under existing brands, Countrywide is not likely to reach new customers in new ways.

Instead, it is only reaching those potential customers who already know their existing brands well enough to find themselves on the website. Therefore it only serves to cannibalize the existing customer base by selling them a lower priced service while simultaneously failing to bring in new customers.

The brand extension problem

In March of this year, Australia’s second biggest real estate group, LJ Hooker, announced that it would launch its own DIY real estate disruptorSettl. The new brand empowers vendors to sell their homes online, in exchange for paying a low fixed fee. It is a direct response to Purplebricks’ 2016 launch into the Australian market.

The key difference between LJ Hooker’s Settl and Countrywide’s online efforts is one of brand. LJ Hooker is creating a new “fighter” brand, while Countrywide is opting for a brand extension.

A fighter brand is designed to combat low-price competitors while protecting an organization’s premium-price offerings.

Imagine you own a lemonade stand that sells premium lemonade. You’ve been in business for years and are well known for offering premium beverages.

One day a low-cost lemonade stand opens across the road, offering lemonade at a tenth your price.

What LJ Hooker has done with Settl is to tackle the new competitor by opening its own, separate low-cost lemonade stand. To the customer’s eye, there is no connection with the existing LJ Hooker brand or the premium values associated with it.

What is Countrywide attempting to do? Sell low-cost lemonade alongside its premium lemonade, at the same stand. Not only is this confusing to customers, but it cannibalizes its existing premium business.

The history of fighter brands is not hugely positive. However, excellent examples can be seen with Intel’s launch of the Celeron processor to combat the threat of low price AMD chips, and the creation of JetStar by Qantas to see off the threat of low cost rival Virgin Blue.

(For more on fighter brands, see “Should You Launch a Fighter Brand?” on Harvard Business Review.)

By launching a brand extension, Countrywide is missing out on the classic benefits of a fighter brand: eliminating competition, protecting the existing premium offering, and opening up new, lower-end markets for the organization. Countrywide’s approach begs the question: Is the offering truly meant to succeed?

Conclusions

The fact that Countrywide’s online offering is a brand extension that does not offer the benefits of a fighter brand leads to two equally straightforward conclusions.

Either the entire endeavor is ill-fated due to major strategic positioning issues, or it is simply a lead-gen effort to support the incumbent business. The continued pursuit, at the cost of a £38m rights issue, of the strategy after an inconclusive pilot suggests this is the case.

Countrywide felt forced to do something; online agencies are perceived by the financial markets to be the greatest threat to its existing business. Purplebricks’ continued momentum, market traction, and rising stock price demanded a response from senior management.

There were a number of options available.

Countrywide could have invested in or acquired another online player in the market, it could have launched its own disruptive brand (as LJ Hooker has done with Settl), or it could have launched a new offering internally.

For whatever reason, the choice is the latter. Viewed from the outside, Countrywide now offers a service on par with the online agencies.

It can tell the market and prospective customers that it also offers a low-fee, online offering. However, customers don’t seem to be buying the new service and the markets aren’t buying the strategy.

In reality, the brand extension offering cannot succeed on its own.

At best, it achieves product parity with online agencies, and offers a platform to upsell potential customers to its premium estate agency proposition.

However, it does not suggest that the business has thoroughly understood the challenges that this must create around issues such as incentivization of staff or servicing a totally new service line with the existing infrastructure and cost base.

If Countrywide’s offering was designed to fail — that is, to not succeed as a standalone business or product, but as lead-gen for its existing business — it does not mean it is a bad strategy.

In fact, it may be the best course of action for the large incumbent as it is relatively low risk and keeps its options open. But if the offering was not designed to fail, significant changes are clearly required to give it a chance of success.

Growth in new markets: An analysis of Opendoor, Knock, and OfferPad

Last December we conducted a wide-ranging analysis of Opendoor, the real estate startup that purchases homes directly from sellers. A look at of thousands of MLS records formed the basis of that piece, showing trends and extrapolating insights from the data.

At the time there were a number of unanswered questions we wanted to dig into: how much money does Opendoor make per transaction, how big could the model really get in the U.S., and does Opendoor have a sustainable competitive advantage against competitors?

Four months later I’m once again looking at the data, with these questions on my mind:

  • What does Opendoor’s traction look like in its (relatively) new markets, Dallas and Las Vegas?
  • Are there any notable changes in Opendoor’s fundamental business operations and metrics?
  • Opendoor has two well-funded competitors in the market, Knock and OfferPad. How are they doing?

After looking at the data, there are three main observations:

  • Dallas, Opendoor’s second market, is doing remarkably well. The transaction volumes there reached parity with Phoenix after only six months.
  • Las Vegas, Opendoor’s third market, is off to a slow start. Key metrics suggest Opendoor is still finding its sweet spot in that market.
  • Knock, Opendoor’s Atlanta-based competitor, is very early stage and has yet to ramp up in any significant fashion.

A snapshot of current volumes

Last time we looked at the data (at the end of November 2016), transaction volumes in Phoenix were going strong, Dallas was on a promising upswing, and Las Vegas was still small.

Since then, overall transaction volumes have surged from around 200 home sales per month to over 300 sales per month in February. In other words, in February, Opendoor was selling ten houses each day (including weekends) across all three markets. Not bad!

This growth appears to be driven by sustained volumes in Phoenix and very strong growth in Dallas -- putting that market on par with Phoenix after only six months.

Opendoor does Dallas

Let me be clear: I’m impressed with the growth in Dallas. When I’m evaluating new businesses and new business models (see my article, The Two Principles of Startup Success), I always look for business model validation (does this work in one market?) and then the ability to scale (can this be replicated in another market?).

Opendoor’s success in Dallas is a resounding answer to that question. Yes, the business can scale beyond one market. This is a noteworthy achievement for the firm.

Like Phoenix, the average selling price in Dallas is well-clustered. During the past three months, Opendoor’s median sale price in Phoenix was $210,000, compared to $212,000 in Dallas.

This suggests that, like Phoenix, Opendoor has found its sweet spot in the Dallas market. It deals with houses in a narrow and specified value range and (generally) does not deviate from that.

Opendoor credits its success to the team in Dallas and their focus on providing customers an experience they love. “We're seeing that customer love translate to growing word of mouth, and a growing business there,” said JD Ross, one of Opendoor’s co-founders.

What about Las Vegas?

I’m so glad you asked. Opendoor started listing and selling homes in Las Vegas at about the same time as in Dallas, last September. But growth has been slow ever since.

The sale price is not as well-clustered as in Dallas and Phoenix. There’s quite a spread of prices that Opendoor sells its homes for.

The median sale price in Las Vegas is also materially higher than Opendoor’s other markets, sitting at $322,000 (compared to $210,000 and $212,000 in Phoenix and Dallas). It’s not a factor of higher house prices in Las Vegas, either. According to Zillow, the median home price in Las Vegas is $209,000 and the median listing price is $247,000 -- which is on par with Phoenix and Dallas.

In Phoenix and Dallas, Opendoor is selling homes for roughly the market’s median home price. But in Las Vegas, it’s considerably higher.

Opendoor has been selling homes for six months in Las Vegas; perhaps its median sale price started high but has been falling to normal levels over time? Nope.

There’s a noticeable oddity in the Las Vegas market, with slow growth, a less-clustered sale price, and a sale price that’s higher than normal. Why?

It’s because Opendoor’s approach to the Las Vegas market is different. “In Vegas we've been focused on partnerships, and haven't pushed to expand to the broader market there yet,” says JD.

This is a different approach than Opendoor has taken in its other markets, with correspondingly different results.

Opendoor has partnered with Lennar (a new home builder) to offer the Lennar Trade Up program for Las Vegas homeowners. It’s a way for homeowners to “trade in” their existing homes to Opendoor as part of a package to buy a new home from Lennar.

This is a different approach than Opendoor has taken in its other markets, with correspondingly different results. My guess is that it’s a lower-cost option for the firm that effectively outsources lead generation to a partner while allowing Opendoor to focus efforts elsewhere. In other words, it’s a test, which is exactly what a you’d expect from a young, growing company.

Knock, Knock

Since the last analysis, two well-funded competitors have entered the U.S. market: Atlanta-based Knock and Phoenix-based OfferPad. Both announced that they raised over $30 million each in January of this year.

Knock is live in Atlanta and currently trading with tiny volumes; we’re talking about one home sold each of the past two months. It also has a very small number of new listings each month, anywhere between one and six over the past four months.

Knock either does not have the price discipline we’ve seen work so successfully for Opendoor, or is not yet enforcing it.

The median sale price for Knock’s ten listings that sold is $290,000. But underneath that, if we look across all listing prices, you can see they’re not clustered at all. The home values are all over the show, meaning Knock either does not have the price discipline we’ve seen work so successfully for Opendoor, or is not yet enforcing it.

There are several key takeaways in looking at Knock:

  • This is a difficult business to be in. Raising money doesn’t give you market share. It takes time, skill, and good operations to build scale.
  • Knock is super early stage. Its transaction volumes suggest it is still tinkering with its core operations and proving it can make the model work before attempting to scale up.
  • Price discipline is important. It may be tempting to deal with higher-value homes where the fees are correspondingly higher, but Opendoor has shown us where the sweet spot for this model really is.

OfferPad, on the other hand, is a more mature business with better traction -- at least in the Phoenix market. With the help of friends at ATTOM Data Solutions, a real estate data company that aggregates data directly from property records (as opposed to my usual MLS sources), I was able to gather a snapshot of relative traction for both businesses in Phoenix.

It's worth a deeper dive into OfferPad, its model, and relative merits. But that will have to wait until another time.

A look at Opendoor’s operations: anything interesting?

To wrap everything up I took a quick look at Opendoor’s core business metrics to see how things are tracking.

To begin with, the much-talked-about home value appreciation has stayed the same with a median average of 5.4% (looking at 43 recent sales). That’s the difference between what Opendoor buys a home for and eventually sells it for -- about $11,000.

And listen: That’s the difference between the buy and sell price. Opendoor takes on a number of costs associated with sprucing up, holding, and selling a house. So don’t confuse that number with profit; it’s not.

If you prefer small dots to blue bars, below is another way to visualise the same data.

The average days on market in Phoenix has seen a slight improvement, moving down to a median average of 41 days from 47 days in the last analysis. That’s a 12% improvement, which if I were running the business I would have as a key metric. It’s a small improvement -- but when time is money -- a welcome one!

Opendoor also has a new logo.


It will be interesting to watch Opendoor’s progress from here. With Phoenix and Dallas firing well, will it expand to a handful of new markets, or is Las Vegas the next area of focus? When it enters new markets, will it follow the partnership model? And will Opendoor launch in Atlanta before Knock puts the foot down on the accelerator?

Are you researching iBuyers like Opendoor and on the hunt for data? Do you work at a consulting or venture capital firm? Check out the iBuyer Analysis Pack.

easyProperty: lessons in how not to build a business

On March 29, easyProperty released its full year 2016 financials to the U.K.’s Companies House. While a few days early, it turns out that it wasn’t an April Fool’s Day joke. The numbers announced begged to be looked at further.

EasyProperty, launched in 2015, is a hybrid online estate agency in the U.K. It has a similar business model to Purplebricks and eMoov, which aim to sell houses for a low, fixed fee instead of a percentage-based commission, and thus disrupt the traditional real estate agency and brokerage model.

EasyProperty has raised just shy of of £40 million since inception, making it one of the best-funded entrants in the field (second only to Purplebricks).

What drew me to this story is the sheer amount of money raised and subsequently spent. According to its filings, easyProperty had a full year loss of £11.4 million in 2016, having lost £6.8 million the year before.

And what did that money buy? A staggeringly small £874,000 in revenue for 2016.

How did easyProperty manage to spend so much money and achieve such little market traction? It’s a crowded space, but there are a number of other players making significant gains. To me, this is a lesson in how not to build a business.

The Purplebricks comparison

Let’s look at Purplebricks for a comparison. It’s a direct competitor as a hybrid online estate agency, also a start-up, and because it’s publically listed has financials we can analyze (which I did so here, looking at how Purplebricks has successfully scaled).

Let’s start with an overview using the most recent data available. For easyProperty, this is its full year 2016 results. For Purplebricks, we have its half-year 2017 results, announced last December.

While the time periods don’t match up, it’s clear to see the disparity between spend and traction.

What’s striking is not how much money easyProperty is spending, but how little return it’s getting for that spend. Back when the business launched, Mr. Ellice, the CEO, is quoted as saying the company expects to be listing 4,000 to 5,000 properties each month by 2016. Two years later, the reality is around 80 properties per month.

There are a few interesting ways to slice this data. First, let’s look at the total cost per listing. This is what each business is spending per listing. Clearly there will be economies of scale and it should be nonlinear, but looking at the metric is illuminating!

EasyProperty is spending around £12,000 for each of its listings, compared to around £1,000 at Purplebricks. That’s not a great return for the massive sums being spent.

At a higher level, we can also look at how much easyProperty is spending for each £1 in revenue. Spoiler alert: it’s not pretty.

So while Purplebricks is spending around £1 for every £1 in revenue (breakeven), easyProperty is spending £14 for every £1 in revenue. That’s an outrageously bad return on investment.

If easyProperty had simply given away 1,000 listings at its list price of £825 each, it would have cost the firm less than 1/10th of what it ended up spending in 2016.

Technology is not a key differentiator

There’s a choice quote in the director’s report: “The directors consider the level of technology within the business to be more sophisticated than its competitors in its capacity to be able to create and maintain product catalogues across multiple verticals and territories, including product variations, variable pricing and packages that may or may not have optional elements.”

I fundamentally disagree with the premise that technology is a key differentiator or represents a sustainable competitive advantage in this space. I’ve researched and spoken to dozens of leaders in this field around the world, and I’ve yet to find a correlation between an amazing technology platform and market traction.

As I recently wrote in my analysis of eMoov’s technology platform, the winning combination is people + technology. And as the eMoov case study makes clear, technology is only as good as the business behind it.

In other words, the fact that your technology supports packages that “may or may not have optional elements” is not a reason to think the business will succeed against competitors.

With a tech team of 26 developers (compared to eMoov’s tech team of nine), my sense is that easyProperty just needs to get on with it and stop investing millions in its technology platform.

Mo’ Money, Mo’ Problems

There are a number of businesses in this space around the world. The most successful have a great customer proposition and scrappy, driven founders with a burning desire to change the industry.

The director’s report states, “...as is typical for businesses at this stage of their lifecycle it is generating start-up losses as it uses working capital to develop the business.”

I’m not sure that I would describe this situation as “typical.” Purplebricks generated losses to build the business. EasyProperty is just spending a lot of money.

The technology behind an online real estate agency: Lessons from eMoov

Online agencies are one of several new models gaining traction in residential real estate. They smartly combine the traditional expertise of professionals with efficient new technologies to provide a low-cost alternative to traditional real estate agencies and brokerages.

Their rise around the world is slow, but the impact they are having is unmistakably big. The top player in the U.K., Purplebricks, has a market capitalization approaching $1 billion after going public in December 2015. 

Collectively, online agencies have around 5 percent market share in the U.K. and are putting the incumbents under increasing pressure. And the battle in the U.S. is about to heat up with Purplebricks raising $62 million to enter the market in the second half of 2017.

The value proposition of online agencies typically consists of a low fixed-fee and an improved customer experience. Technology plays a key role; online agencies rely on it to empower consumers, bring transparency to the transaction and improve overall efficiency (thus allowing them to charge lower fees).

If technology is a key point of difference, what exactly does it do? What does it look like and how does it add value to the transaction?

Tech is a critical component of an online agency’s value proposition. Here, we’re going to dive deeper, looking at exactly what this tech looks like for a leading online agency, how it adds value and what lessons we can learn.

Case study: eMoov.co.uk

EMoov is one of the leading online agencies in the U.K., having served over 20,000 customers since its founding in 2010. 

EMoov’s technology platform started development in 2013 and is currently on its third iteration, which is one of the big reasons eMoov is appealing as a case study. Not only has the tech platform been in operation for around four years, the team behind it has had a chance to learn and iterate.

Another important factor: The technology is being used at scale. The company lists between 300 and 400 homes each month, and it expects to list nearly 7,000 homes in 2017. This is not technology built in a basement without users — it’s battle-tested in the field and being used to sell homes.

At a high level, the technology platform does two main things:

  • It empowers customers in a way that allows transparency and control over the transaction.
  • It reduces costs at scale by making eMoov’s internal agents more efficient.

EMoov believes technology plays an important part in real estate by empowering customers and making agents more efficient. But it also believes property professionals are still needed in certain areas, like negotiation.

Ivan Ramirez, eMoov’s CTO, sums up his philosophy: “It was important for us to fully automate certain parts of the journey, like property onboarding, a well as viewings, but we knew that other parts, like offer negotiations and progressions, was an area where we needed to keep the human element present.”

“We still use technology in these areas of the selling process, but it’s more focused on empowering the agent and providing transparency to the customer,” Ramirez added.

A history of iteration

“Historically, technology has been absent from the property transaction, save for search via the portals and agent-facing office management software,” said Russell Quirk, eMoov’s CEO.

Russell thinks that a number of the players in the online agency space, in addition to all of the participants in the traditional sector, grossly underestimate the amount of work required. “It’s a two-year project at a minimum and a massive seven-figure investment,” he adds.

EMoov’s technology has gone through a number of iterations, not all of which have been successful. “We’ve ripped up an entire build and thrown it away and a team with it,” Quirk said. “We adopted a waterfall approach and just didn’t listen to the customers. We focused more on the solution than understanding the problem.”

Now, however, the team is firing on all cylinders and innovating, iterating and deploying new features on a weekly basis.

Ramirez and his team of product managers spend a lot of time in the trenches, shadowing agents dealing with customers, understanding the existing process and looking at customer feedback from support tickets. 

“The goal was to pull out meaningful feedback that would allow us to challenge the existing business processes,” Ramirez said.

“We looked at our internal team’s business processes even further, as well as our customers’ desired journeys, information they wanted to see, and how to present it all in a way that makes sense to them. The way our customers and our internal agents consume and interact with the product is completely different.”

Ramirez believes in a process of continuous improvement and that a product is never complete. 

He’s also implemented a culture of product development that aligns to key business metrics. 

Everything that’s built has an associated metric to be measured against. In his opinion, this is why eMoov is able to operate a business at a low cost while keeping a high level of customer service.

Enhancing the customer journey

“Customers of all ages and demographics embrace being in control and having 24/7 access to their listing and their transaction,” Quirk said. By presenting everything to its customers, eMoov is able to bring a strong degree of transparency to the process.


The property dashboard gives users — both homesellers and eMoov’s agents — a comprehensive look at the property listing. 

Relative listing popularity and key performance metrics from the major listing portals (Rightmove in the U.K.) are shown alongside a snapshot of viewings and potential buyer feedback.

EMoov has attempted to automate the entire process of scheduling viewings. Sellers define the times they are available to show the property to potential buyers. The company’s agents then work within these timeframes to help schedule showings for the seller.

On the other side, potential buyers are presented with an online tool to schedule a viewing, as seen below.

The entire process occurs online for the more than 5,000 viewings that eMoov arranges each month. And it’s more efficient; 93 percent of viewing confirmations now occur online automatically. “We’re now doing this with half the staff that we were deploying to do half as many viewings a year ago,” Quirk said. 

Improving team efficiencies

Ramirez subscribes to a Warren Buffett philosophy, which is that successful businesses need to be low-cost operators. “We have been able to significantly decrease the cost of service in the first part of the seller journey by really operationalizing the product in a way that makes every contact that we do have with our customers more efficient,” he adds.

“In an omni-channel approach, this is a must to succeed as you need to be able to service that customer in whichever way they want to be serviced at different stages of the journey,” Ramirez said. “It’s very difficult to force a customer through a rigid interaction, so the product needs to be flexible and empower whomever engages with it.”

As an example, the customer onboarding process is how a new listing gets on the market. It typically consists of the following steps:

  1. Provide property details (description, rooms, highlights and so on)
  2. Set the selling price
  3. Schedule the photographers to come take the photos
  4. Set viewing availability
  5. ID checks

A year ago, the steps listed above were all done manually. Today, 90 percent of eMoov’s customers do the steps above on their own using the tech product. This “hand-holding” approach has been transformational for its business and significantly tightened the time it takes to list a new home.

The impact on cost is equally material. The team that supports this operation had 15 people, but now the firm only needs nine people to handle nearly double the number of new customers. Historically, productivity has chugged along at less than 60 cases per person, and now the team is up to over 100 cases per person.

EMoov currently has around 50 staff members, of which seven are engineers and two are product people. 

In comparison, there are 11 staff members in offers and progressions and eight in support. It’s this combination of intelligent tech plus experienced property professionals that makes the entire operation efficient and successful.

The platform essentially has a workflow functionality that puts tasks in front of the agent, helping to progress the sale one task at a time. “It takes the thinking out of the progressions job,” Ramirez said. 

The platform also manages the chain on the property being sold, as seen below, giving a holistic view of the entire transaction.

Lessons learned and future plans

Some of eMoov’s biggest wins have been around customer onboarding, automated viewings and collecting feedback. Each of these areas has benefited greatly from technology to streamline and automate the process.

On the flip side, one area that surprised the team was virtual tours. “Virtual tours didn’t add any value to our listings. We didn’t see a faster time to offer; we didn’t see less or more viewings,” Ramirez said. 

When evaluating interesting new technologies, eMoov is in a unique position as it sits across the entire transaction and can see the utility (or lack thereof) of adding new features like tours.

EMoov has identified machine learning, artificial intelligence and chatbots as areas of future, long-term focus. 

Developments in these tech realms can improve service areas like valuations and viewings. 

In the short-term, however, the focus remains on iterating the offers and sales progression components of the platform to improve efficiencies and give customers more control and transparency.

Final thoughts

No matter what your role in the industry is, there are lessons to be learned from what online agencies like eMoov are able to bring to the market. 

Namely, that there’s room to provide homesellers an improved experience. Technology plays an unmistakably important role in enhancing the customer experience of buying and selling real estate.

As someone who looks at a lot of businesses in real estate tech (with a focus on finding winning models), I see a number of key takeaways from the eMoov story:

  • The winning formula is technology + people. You need both to succeed.
  • Success comes from more than technology and user interface; it’s the team, the methodology, and an ethos of continuous improvement.
  • A good tech product is a big investment and long undertaking and can’t be acquired off-the-shelf.
  • Ultimately, the product must be good for consumers. It needs to add value and make the transaction easier and more efficient through transparency and automation, 24/7.

Purplebricks results show promising trends

Earlier today Purplebricks announced their interim results for the six months ended 31 October 2016. How exciting!

The chart below could effectively be called "scaling." It shows how Purplebricks managed to more than double their revenue during this time period without increasing their fixed and variable costs. While cost of sales increased linearly with revenues (think the payments to their local property experts for securing a listing), their admin expenses and sales and marketing costs stayed the same.


This shows the business model successfully scaling by reaching more customers per advertising dollar. 

You can see the equally stunning growth in listings (aka instructions aka someone paying Purplebricks to sell their home) below. 


Wow! We're talking more than doubling customers and more than doubling revenues. 

Even more so when you consider the average customer acquisition cost (how much money the business needs to spend to get a new customer). In the same period last year, that number was worryingly close to the fee Purplebricks charged customers (£849 vs. £825), making it impossible to turn a profit.

But wait, look!


Those customer acquisition costs have dropped - significantly - to around £350. That is the most interesting bit of information in this update, given it is a very robust answer to the question, "Can this model make money?"

This interim update is quite remarkable in that it shows further proof the Purplebricks business model works. While initial costs greatly exceeded revenues as the company built scale, what we're seeing now is proper scaling.

There is still the open question of how effective Purplebricks is at selling houses (as opposed to listing them), but I won't wade into that here (here's looking at you, Jefferies). But for now, I'm quite impressed with the results and what it shows for the prospects of not just Purplebricks, but the entire industry.

Note: inexplicably, many of the numbers above are not explicitly mentioned in the results. However, it's easy enough to figure out given the stated revenues, average revenues per customer, and a few assumptions.