The Pandemic’s Varied Effect on International Real Estate Markets

The pandemic affected international real estate markets in strikingly different ways. Markets with stringent lockdowns saw new listings plummet by 90 percent, while other markets saw no change. And as the world begins to recover, the data suggests that the longer and more severe the lockdown, the faster the initial recovery.
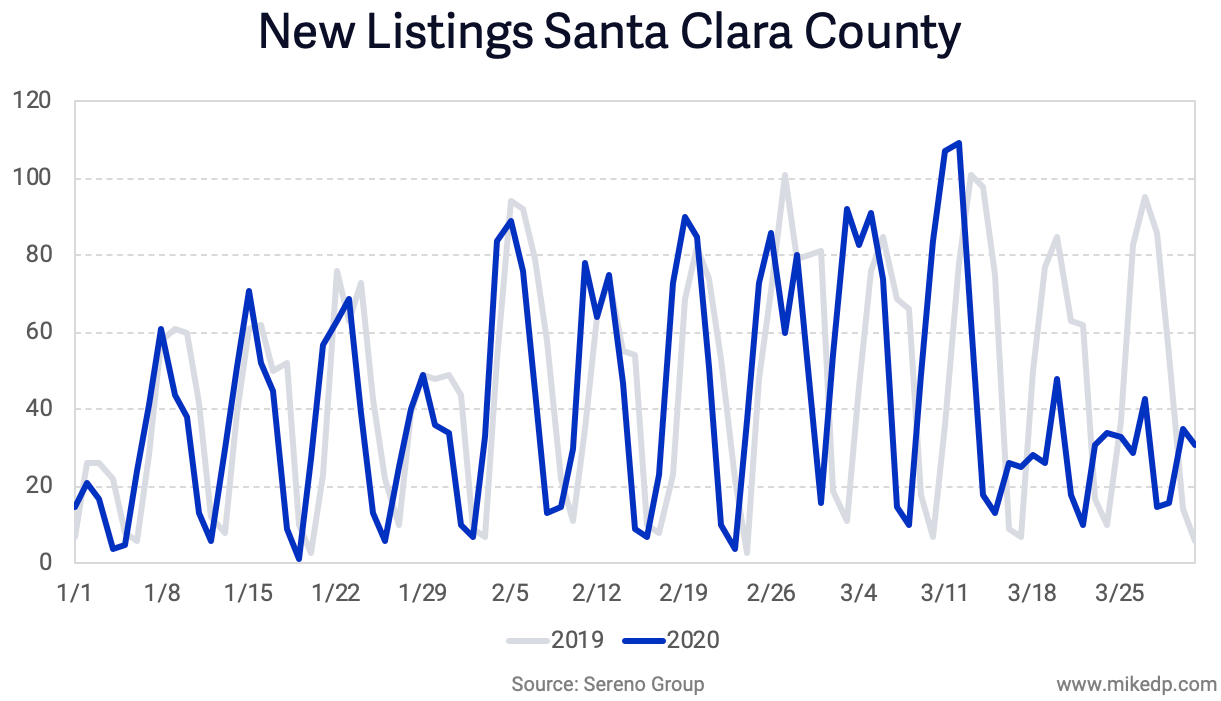
New Listings

The number of new listings coming to market is a key indicator of a healthy real estate marketplace, representing high-intent seller demand and available inventory. The decline in new listing volumes across seven countries has varied wildly, from no change to a 90 percent drop, depending on the market and its associated lockdown.

Screen Shot 2020-05-20 at 7.13.23 AM.png

Unsurprisingly, the drop in new listing volumes is tightly correlated to the severity of lockdown imposed by national and local governments. Of the nations analyzed, Italy and the U.K. had the most stringent lockdowns, with many real estate activities deemed non-essential and severely limited. The drop in new listings was greatest in these markets: between 75-90 percent.

The Australian, U.S., and Canadian real estate markets were less restrictive, and the drop in new listings reflects that: 40-50 percent at a national level. In the U.S., that number varies greatly by state, with some markets (Pennsylvania, Michigan, and New York) mirroring the severe drop of up to 90 percent seen in the U.K. and Italy.

Most surprisingly, some markets were barely affected. The Netherlands and Sweden imposed “intelligent lockdowns” far less restrictive than many other countries. As a result, The Netherlands in particular hasn’t seen a significant drop in new listings; rather, it’s enjoying annual highs. Interestingly, new listing volumes in Sweden have seen a limited, delayed decline -- about a month after most other markets -- of 20 percent.
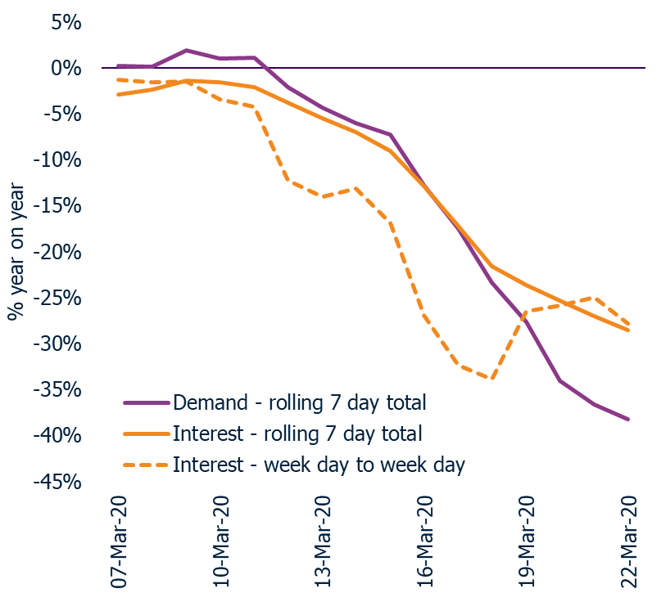
Portal Traffic

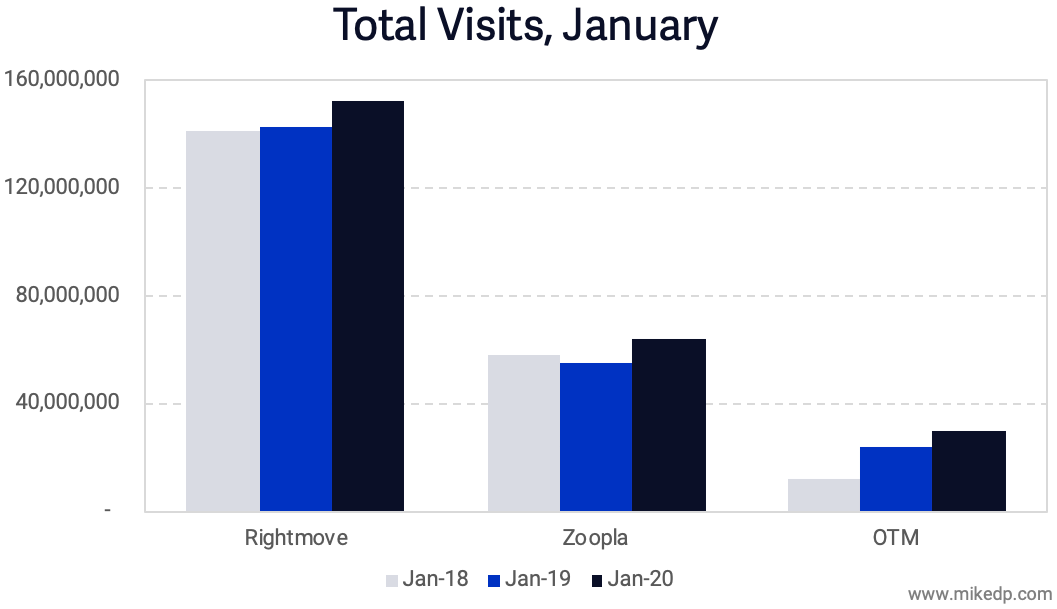
Web site and mobile traffic to real estate portals suffered an expected drop, but quickly recovered in most of the markets analyzed. 

Screen Shot 2020-05-20 at 7.13.24 AM.png

Once again, markets with “intelligent lockdowns” -- The Netherlands and Sweden -- saw less of a drop and are currently experiencing annual highs. Australia and the U.S. quickly recovered and are up from last year, while the U.K. lagged behind due to its stringent lockdown (why browse when the market is closed).

A less restrictive lockdown doesn’t directly affect someone’s browsing behavior. But the closer to “normal” a lockdown is, the more consumers will continue their normal portal browsing behavior.

A Fast Recovery

Based on the evidence from the U.K. and Italy, it appears that the longer and more severe the lockdown, the faster the recovery. Both countries have seen a surge in new listing volumes after restrictions were lifted, a signal of strong pent-up demand. The following chart shows the rise in new listings after the U.K. reopened the housing market on May 13th.

Screen Shot 2020-05-19 at 2.04.47 PM.png

That market behavior is similar to two of the hardest hit U.S. markets -- Pennsylvania and Michigan -- which prohibited most real estate activity and saw new listings drop 70-80 percent. After easing restrictions, Michigan’s Detroit and Grand Rapids saw an immediate surge in new listings come to market -- similar to Italy and the U.K. 

Screen Shot 2020-05-18 at 5.20.41 PM.png

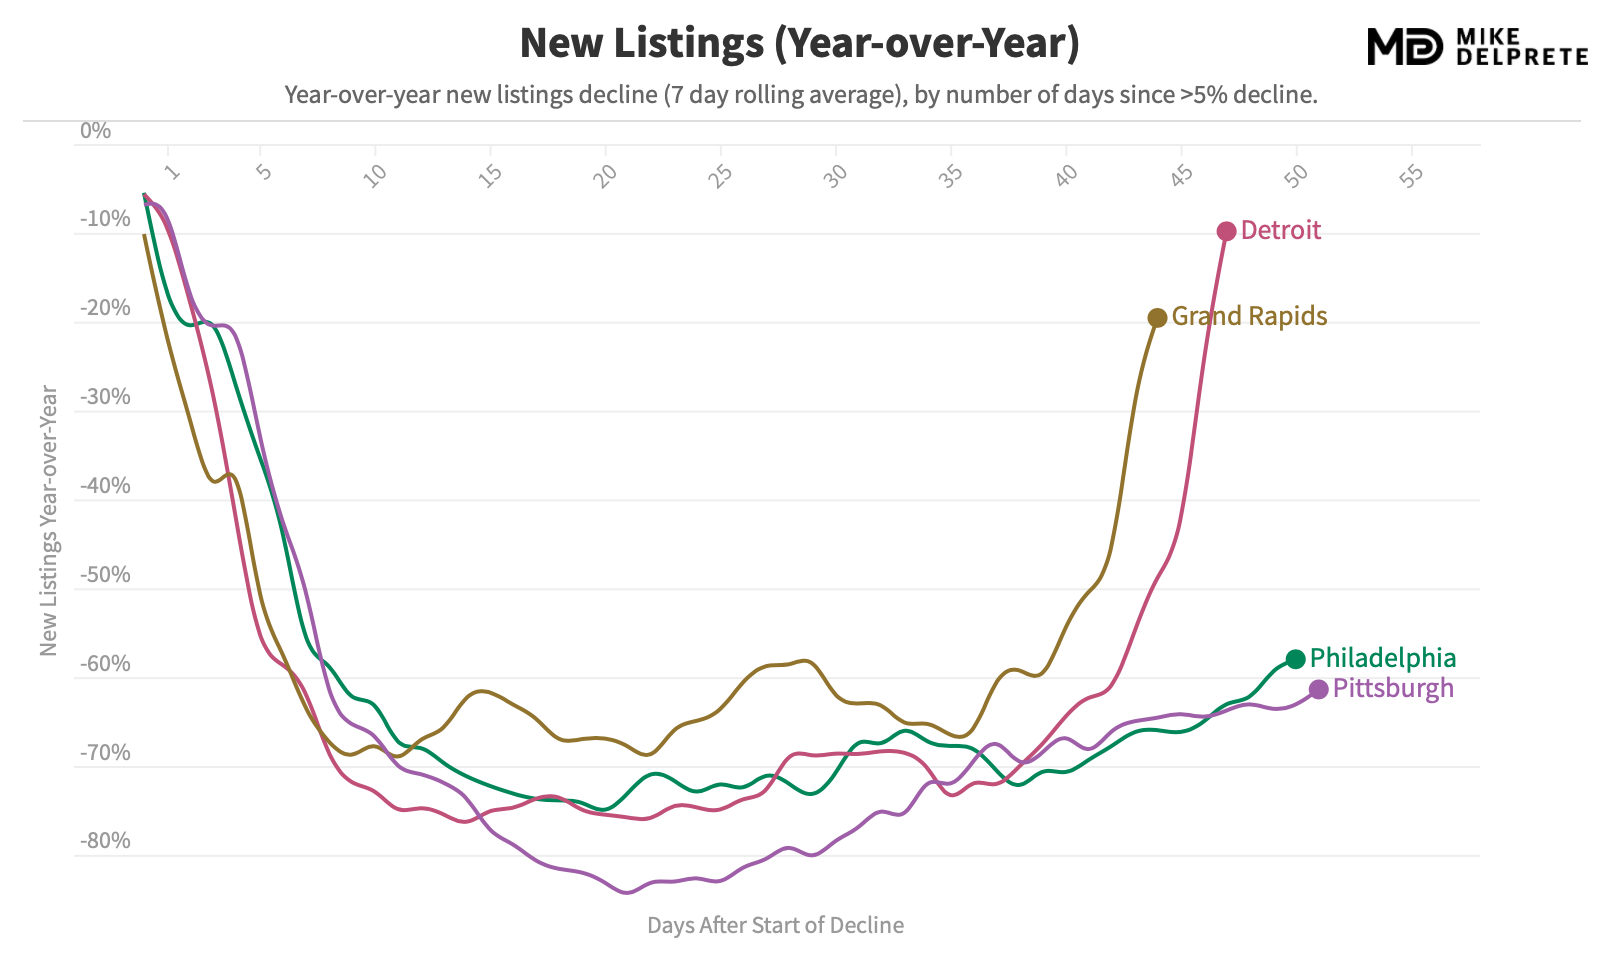
The evidence suggests that once restrictions are lifted in the hardest hit markets, new listings rebound quickly. However, new listings are only one component of a full market recovery. Buyer demand, leading to completed real estate transactions, will come over time -- and it’s unclear how long that recovery will take.

A Note on Data Sources

This analysis uses previously unpublished data from a number of international real estate portals and organizations: 

  • Hemnet (Sweden’s top real estate portal)

  • Funda (The Netherlands’ top real estate portal)

  • REA Group (Australia’s top real estate portal)

  • Zoopla (U.K.’s #2 real estate portal)

  • Fourwalls and rennie (Canada)

  • A top Italian real estate portal (Thanks!)

  • Redfin’s Data Center (U.S. new listing volumes)

  • Zillow’s quarterly shareholder letter (U.S. traffic volumes)

Thank you to the leading real estate portals and other organizations around the world that collaborated with me to produce this first-of-its-kind international analysis. How does your market compare? Let me know!

An Analysis Of Pending Sales, A Proxy For Buyer Demand

Much of my market research has focused on new listings coming to market, a strong proxy and indicator of seller demand. Now I've turned to pending sales -- offers being made and accepted on a home -- as an equally strong proxy for buyer demand.

As expected, the number of pending sales is beginning to rebound in some markets as restrictions ease.

Pending sales -- representing increased buyer demand -- are increasing in a number of cities like Tampa, Chicago, and Seattle. Following a significant dip around the end of March, the number of pending sales has steadily increased throughout April, in the all-too-familiar checkmark shape.

However, not all markets are recovering. Several major East and West Coast metros, including New York City, Philadelphia, San Francisco, and Los Angeles, are still in their lows and have yet to see the number of pending sales recover.

8728631d-6c68-4e0d-bb96-d18352bbf795.png

Comparison to Last Year

The analysis above simply looks at the number of pending sales over time. Given the seasonal nature of real estate, a second, important dimension to consider is year-over-year performance: How does 2020 compare to 2019?

An annual comparison shows many markets down between 20-80 percent compared to the same time last year, with some recovering, and others still flat.
 

Some markets, like Austin, have recovered quickly with pending sales at the same level of last year -- highlighting strong buyer demand. While it is recovering, Seattle is still down a significant 20 percent from last year, with New York and San Francisco still down 60-80 percent from 2019 volumes.

3cfeec06-cf15-41c4-a6dd-f498dbbb8fb2.png

The advantage of plotting data over time is the ability to reveal momentum. Markets like Nashville, Raleigh, and Charlotte are all trending lower; buyer demand is not picking up as quickly as last year. Not all markets are in recovery mode.

Key Takeaways

The data suggests that buyer demand (as represented by pending sales) has been significantly effected by the pandemic. Volumes are down over 35 percent nationally, with some markets down as much as 60-80 percent compared to last year. Buyer demand is beginning to recover in some markets, but not all.

Try it Yourself

I was recently quoted in an article on Curbed: "No matter what narrative you have you can support that story with data. You can find data to support any story you want, whether it’s everything is fine, it’s the end of the world, or something in between.”

My goal with this analysis is to replace uncertainty with data, and to give you the tools to explore the data directly: try it out with my Real Estate Market Tracker.

(It's worth noting that while the data comes from Redfin, it's not perfect. Several markets, including Atlanta, Dallas, and San Antonio were removed from this analysis because of significant data issues. I hope to include them in the future.)

Growth Challenges: Zillow vs. realtor.com

Last week both Zillow Group and News Corp’s realtor.com announced quarterly financial results, revealing two companies in starkly different periods of growth. Zillow is growing, realtor.com is not, and the latter is making significant moves to change course.

Differing Growth Trajectories

The largest revenue driver for each business is selling leads to real estate agents: Zillow’s Premier Agent program and realtor.com’s real estate revenues.

In the most recent quarter ending March 31, 2020, Zillow’s premier agent business grew by $24 million (11 percent) compared to the same period in 2019. By comparison, realtor.com’s real estate revenue did not grow at all. In the quarter before that, Zillow’s premier agent program grew by $12.5 million (6 percent), compared to $4 million (4 percent) at realtor.com.

 
Screen Shot 2020-05-11 at 10.02.53 AM.png
 

Over the past six months, Zillow's real estate lead gen business has demonstrated solid growth while realtor.com's has struggled.

Leadership Changes

Over the past two years, Zillow’s premier agent program has certainly had its challenges, with growth slowing significantly for a period of time before reaccelerating. The decline -- and resurgence -- in growth pivoted around a leadership change in February 2019, with Rich Barton taking the reins as CEO.

 
Screen Shot 2020-05-11 at 9.05.24 AM.png
 

Annual revenue growth at realtor.com has fluctuated over the past two years, dipping into negative territory on a number of recent occasions. In the past year, revenue growth has only been positive in one out of four quarters. Similar to Zillow, a leadership change occurred in the midst of the decline, with the departure of the CEO in June 2019.

 
Screen Shot 2020-05-11 at 9.05.22 AM.png
 

Both companies have struggled with revenue growth, and investors -- along with corporate owners -- clearly don’t like stagnation. Chief executives were replaced in both companies when revenue growth stalled.

The recent strategy at realtor.com reflects a significant effort to correct its past lackluster performance. This year, a permanent CEO was appointed in January, several longtime execs were replaced by a pair of Opcity leaders in April, and significant layoffs were enacted in May. These are all bold moves made in an effort to restore growth.

International And U.S. Markets See 50-75% Drop In New Listing Volumes

As the pandemic and associated effect on the real estate market spreads, one of the best leading indicators of a decline in transaction volumes -- new listings -- has dropped an average of 63 percent in the earliest hit markets. Seattle, the Bay Area, and New York City -- along with Italy and the U.K. -- were among the first markets hit, and are the best examples of what comes with strict lockdowns.

Declining Market Activity

In Seattle (King County), the number of new listings is down 54 percent on a weekly basis, and continues to trend lower.

 
Screen Shot 2020-04-05 at 9.59.19 AM.png
 

On a weekly basis, new listings in the East Bay market of California are down 70 percent since the start of shelter in place orders. Listings typically increase at this time of year.

 
Screen Shot 2020-03-30 at 2.01.21 PM.png
 

In Santa Clara county, which went on lockdown March 16th, new listings are down 48 percent on a weekly basis.

 
Screen Shot 2020-04-05 at 9.48.47 AM.png
 

In New York City, new listings are down a whopping 78 percent across Manhattan, Brooklyn, and Queens, and continue to trend lower.

 
Screen Shot 2020-04-05 at 9.48.42 AM.png
 

Many shelter in place orders took effect in mid-March, so we’re just starting to see the effect on the housing market.

International Peers

The trend is similar in a number of international markets. According to Zoopla, the #2 portal in the U.K. (which exclusively shared the following information with me), new listing volumes are down 70+ percent across the country. It’s a shocking decline that will have ramifications across the industry for the rest of the year.

 
MDP03042020.png
 

In Italy, a top portal shared with me that new listings were down 60 percent from normal volumes during the third and fourth week of lockdown.

 
Screen Shot 2020-04-06 at 7.44.15 AM.png
 

It's important to note that this appears to be the bottom; after 2-3 weeks of lockdown, new listings were down 60 percent and have not dropped any lower.

A drop in new listings directly correlates to the severity of lockdown. Some international markets, like Germany, the Netherlands, and Sweden -- with less stringent lockdowns -- have not seen a dramatic drop in new listing activity.

The Ability vs. The Will To Buy A Home

When evaluating the pandemic’s effect on the market, it’s tempting to focus on the legal, logistical, and practical aspects of transacting real estate: is it an “essential” business, can open homes take place safely, and can closings occur online?

But that analysis misses an important psychological piece: Will consumers buy homes? Given the incredible market uncertainty, job uncertainty, and health and safety considerations, will consumers choose right now as the ideal time to buy or sell a home, or will they wait? Just because they can, doesn’t mean they will.

A Mild Case of Confirmation Bias

Many markets have yet to experience the full effect of the pandemic and lockdowns on home sales. Assuming it takes 90 days to sell a home, from listing to close, it will take several months to see the effects of a drop in new listings.

Given that inherent delay, there’s plenty of data available -- especially in markets that have yet to be hit -- that everything is fine. Homes are selling, listings are coming to market, and buyer demand remains strong. 

Confirmation bias is the tendency to search for, interpret, and favor information in a way that confirms one's prior beliefs or hypotheses. It’s quite easy for a real estate professional, who believes their market won’t be affected like the others, to find evidence to support that belief.

Evidence from international markets such as China, Italy, and South Korea, plus leading indicators from the first markets to be hit in the U.S., clearly shows the effects of strict lockdowns. The key criteria as the pandemic and lockdowns spread is timing; just because the tidal wave hasn’t hit yet doesn’t mean it won’t arrive.

Real Estate Portals See Up to 40% Drop in Traffic, Leads

The spread of the coronavirus -- and associated lockdowns, quarantines, and travel restrictions -- have caused a dramatic drop in traffic and leads at the world’s top real estate portals. These metrics are critical indicators of a top of the funnel slowdown in the real estate market.

A Global Overview

The data below is from a handful of leading real estate portals around the world: SeLoger in France, Zoopla in the U.K., Funda in The Netherlands, Zillow in the U.S., and a European portal and a U.S. portal that wish to remain anonymous. The evidence is clear: on average, portals are seeing around a 30 percent drop in traffic (as a weekly moving average) as a result of the pandemic.

 
Screen Shot 2020-03-26 at 10.32.29 AM.png
 

The data shows a similar, although slightly higher, decline in the number of leads being generated by the portals -- ranging from 28 to 50 percent, with an average of 33 percent.

 
Screen Shot 2020-03-26 at 10.24.48 AM.png
 

The spreading pandemic is clearly affecting the world’s top portals. They are generating less traffic and considerably less leads, which is a reflection of a slowing property market. 

U.K. Snapshot: Zoopla

Zoopla is the U.K.’s second-largest portal by traffic, and is on the front lines of up-to-date data analysis. Over the course of March, it has seen a 30 percent drop in traffic (interest) and a 40 percent drop in demand (leads generated through the system).

 
Report fig 3.png
 

Interestingly, Zoopla is seeing a slight rebound in traffic over the past few days -- likely as consumers adapt to their new reality, shut themselves indoors, and turn to the portal as a form of browsing entertainment. The trend is similar in The Netherlands, where leading portal Funda reports that traffic is slowly growing back to normal levels.

U.S. Snapshot: Zillow

During an earlier conference call, Zillow stated its traffic was down 20 percent from last year. Considering its traffic was up 10 percent annually in the previous quarter, the weekly decline is closer to 30 percent -- which matches the stated decline in connection requests, or leads, through the system.

Another large U.S. real estate portal (not a publicly traded company) was willing to anonymously share its traffic and lead statistics. The 30 percent traffic drop in March is clear (and most likely reflective of the other U.S. portals).


This same portal reports a corresponding drop in leads of 28 percent, closely matching the drop in traffic, and nearly identical to category leader Zillow.

True Discounts

Earlier this week I conducted an analysis of how the top real estate portals around the world were reacting to Covid-19, primarily by offering customer discounts. For agent and broker customers of these portals, it’s worth understanding that a reduction in fees comes along with a reduction in leads.

For example, Zillow is offering its premier agent customers a 50 percent discount, but for 30 percent fewer leads. 

 
Screen Shot 2020-03-26 at 10.46.11 AM.png
 

Assuming a hypothetical situation where a customer was spending $10,000 for 100 leads, that customer is now spending $5,000 for 70 leads -- the true discount is closer to 29 percent.

Top of the Funnel

A drop in portal traffic -- and the associated leads generated through the system -- is the ultimate, top of the funnel measure of a slowdown in real estate transactions. Consumers are reducing their visits to real estate portals, which is a more passive interaction with the market, and significantly reducing the number of lead forms filled out to inquire about a property, which is a more active measure of intent.

A drop in leads will ripple through the entire real estate ecosystem. Less leads for agents means less business, and less business means less transactions. The key questions to watch in the coming weeks (and months) are: Does the drop in leads go any lower, how long does the decline last, and how long will the recovery be before we’re back to normal levels?

Further Reading and Thanks

I've published several analyses of the massive changes occurring in the real estate industry since the COVID-19 pandemic:

I have deep gratitude for the portals that shared their data for this analysis -- either publicly or directly with me. Making this information available helps us replace uncertainty and fear with a growing certainty and resiliency. Thank you!

How Real Estate Portals Are Reacting to COVID-19

As the coronavirus pandemic and the associated impact upon global economies spreads, the world’s leading real estate portals are all making big moves in response. Significant discounts are being rolled out for customers, new products are being launched, and sobering revenue projections are being shared.

The Leading Portals React

Strict quarantines, market uncertainty, and travel restrictions are causing plummeting real estate transaction volumes in many markets. Portals are facing -- and will face in the coming weeks -- a significant drop in traffic and leads. In France, top portal SeLoger noted a 40 percent drop in traffic, while in The Netherlands, leading portal funda noted a 35 percent drop in leads (more on this in a future analysis).

The drop in traffic and leads, in a market where transaction volumes are dropping by up to 80 percent, is causing portals to roll out significant discounts for their agent customers. 

 
Screen Shot 2020-03-27 at 7.28.23 AM.png
 

In the U.S., leading portals Zillow and realtor.com announced deep discounts on agents’ next monthly bills, with Zillow cutting 50 percent and realtor.com 60 percent. While a welcome savings to an agent’s bottom line, it comes at significant cost, with Zillow estimating a $40–$50 million hit to revenue. It’s unlikely the crisis will be over in a month, so there’s a good chance the discount may be extended beyond April.

The leading portals in the U.K. are following a similar approach, but with deeper and longer-lasting discounts. Rightmove is slashing 75 percent off agent bills for four months -- at a cost of £65–£75 million. For a business that booked £289 million in revenue during 2019, that’s a material hit.

The #2 portal, Zoopla, is being even more aggressive with its discounts. Agents can get 3–5 months completely free, or nine months free if the customer leaves Rightmove and commits to an 18 month contract.

In Australia, leading portal REA Group is postponing its July price rise (8 percent), and offering free re-listings of premium depth products. 

Germany’s Scout24 is offering to defer one month’s payment for up to nine months, and is offering free private listings for consumers. And in France, SeLoger is deferring March fees and making April fees free. Both Scout24 and SeLoger are also offering free premium products to agents at the end of the crisis.

Product Improvements

In addition to discounts, some fast-moving real estate portals are making product improvements in response to the dynamic situation. Sweden’s Hemnet rolled out live streamed open house viewings for its agents last weekend, and is working on further product improvements to streamline transactions with limited direct human interaction.


In The Netherlands, funda kicked off a week-long hackathon to respond to changing customer needs. The focus is on providing fresh data and insights for customers, and enhanced support for remote viewings.

Observations and Strategic Implications

I note a few key takeaways from the evidence above:

  • The discounts will cause a huge impact on revenue. Rightmove is projected to take a £70 million revenue hit -- or 27 percent of total revenue in 2019. Zillow’s revenue hit could approach 10 percent (of premier agent revenues) or more. These revenue hits don’t include customers that cancel their subscriptions or simply go out of business during the year.

  • There is a significant spread of discounts being offered, from simple deferments to multiple months completely free. The more competitive the market, the more competitive the offers are in order to retain or attract customers. The discounts are deepest in the U.K.

  • Certain markets, including Australia, Sweden, and New Zealand are vendor-funded, meaning the homeowner pays the portal listing fee, not the agent. The portals in these markets have not yet offered discounts, but will still feel a revenue hit when new listings drop.

It’s a fast-moving, dynamic time in the portal industry. The major players are all making significant moves to retain their agent customers and ease their upcoming financial burden.

What to Expect When You’re Expecting Revenue Growth: Rightmove’s Strategy

Rightmove’s annual financial results were released on February 28th, revealing a business whose revenue growth has dropped to an all-time low. This analysis focuses on several key charts -- all about growth -- that are absent from Rightmove’s annual report, but are critical to understanding its strategy.

Declining Revenue Growth

Rightmove’s revenue growth in 2019 was the smallest it's ever been -- 8 percent -- the low point in a multi-year decline.

 
20f07e1f-8e9b-4e94-ab3f-7af42632e58b.png
 

The primary driver of Rightmove’s revenue, representing 72 percent of total, is the core agency listing business. This consists of fees that estate agents pay to list properties for sale on Rightmove. The growth rate of this business has dipped to 4 percent, less than half of last year, and the lowest rate in years.

 
b90192ac-b934-4c69-b8a9-5bff0dd4fa61.png
 

Rightmove has saturated the U.K. market. Every estate agent that could possibly be a customer generally is. Therefore, the only way to increase revenues in the agency listing business is by raising prices, evidenced by the following chart from Rightmove’s annual report.

 
b90192ac-b934-4c69-b8a9-5bff0dd4fa61.png
 

The vast majority of Rightmove’s revenue growth -- 84 percent -- came from raising fees. However, Rightmove’s ability to raise prices -- or, as I like to say, to charge customers more money for the same service -- is diminishing. Average revenue per advertiser growth, or ARPA, continues to decline year after year. 

 
7a09b819-ab95-4618-91df-d10ccc939e83.png
 

Responding to Slowing Growth

Rightmove’s revenue growth is slowing, and investors may have a growing curiosity about the source of future growth.

In the U.S., Zillow underwent a similar slowdown in its core lead generation business, the flagship Premier Agent program. During the second half of 2018 and 2019, revenue growth in the business significantly slowed and nearly stopped, illustrated in a chart not too dissimilar from those above.

 
75069962-6b5a-49b3-8293-88ed21ced86e.png
 

What does a business do when growth in its primary revenue stream slows? Launch new revenue streams, of course.

In the midst of Zillow’s growth slowdown, it launched several new initiatives: Zillow Offers, its iBuyer business, in mid-2018, a new pricing model, Flex Pricing, in October 2018, and in November 2018 it acquired a mortgage company.

Zillow Offers and Zillow Home Loans offered completely new revenue streams for the business to grow, and Flex Pricing offered its customers a new way to utilize its core service with a different pricing model, and not just higher prices. In the face of growth headwinds, Zillow acted decisively to diversify its business model.

Rightmove's Strategy

Measured by traditional financial metrics, Rightmove is a fantastic business. It is a category leader in the U.K., with an enviable profit margin of 74 percent on revenues of £289 million. But as a public company, it naturally faces pressure to grow -- and that growth has steadily slowed over a number of years.

But even with slowing growth, Rightmove has maintained its commanding traffic lead over rivals (as illustrated in my strategic analysis of real estate portal leadership). Rightmove does not appear to be at risk of losing its market dominance.

 
4bcc2b05-99bf-4655-a731-22f49107ee5e.png
 

What Rightmove is demonstrating -- consistently, year after year -- is a unique strategy in the world of real estate portals. While other portals are vertically integrating, diversifying their services, or getting closer to the real estate transaction, Rightmove maintains a conservative and focused approach.

Time will tell if this approach is sufficient, or if Rightmove will also need to act decisively to diversify its model to satisfy shareholder demands to grow.

Millions More Buyers: A Real Estate Portal’s Competitive Advantage 

REA Group, Australia’s leading and the world’s most profitable real estate portal, recently unveiled a new advertising campaign theme that succinctly sums up a portal’s competitive advantage: Millions More Buyers.

Real estate portals benefit tremendously from network effects, which is the key factor that gives them unprecedented market power and an impregnable moat to repel competition. This analysis looks at international portal leadership across three markets, and explores the challenges of competing with a leading portal.

The Power of Network Effects

Network effects is the phenomenon whereby a service becomes more valuable when more people use it. Online marketplaces and social networks such as Facebook, eBay, and Craigslist are classic examples of businesses with network effects.

Businesses that have the benefit of network effects are incredibly difficult to displace. Even if a new entrant’s product is objectively better, a smaller audience of potential buyers and sellers means an inferior consumer proposition. Sellers want to advertise to the biggest audience possible, and buyers want the largest selection possible.

Real estate portals like REA Group in Australia and Zillow in the U.S. have a strong competitive position because they have Millions More Buyers than any other platform. This key attribute, enabled by network effects, results in leading portals easily maintaining their leadership position against well-funded competition.

Rightmove vs. Zoopla vs. OnTheMarket in the U.K.

In the U.K., Rightmove is the long-standing dominant real estate portal, Zoopla number two, and OnTheMarket the industry-backed upstart.

For all the cyclical uproar aimed at Rightmove over its ever-increasing fees, its traffic dominance shows no signs of waning. It remains the undisputed best place to advertise properties for sale, with Millions More Buyers than its closest competition.

 
Screen Shot 2020-02-29 at 6.58.41 PM.png
 

All three portals reported higher January traffic than the two previous years. And while the percentage gains sound impressive for the smaller portals, it’s from a smaller base.

 
Screen Shot 2020-02-28 at 4.42.34 PM.png
 

Of more interest is the net gain of new visits: 9 million for Rightmove, 8.3 million for Zoopla, and 6.5 million for OnTheMarket. Rightmove captured the most new visitors, with Zoopla close behind, while OnTheMarket captured 28 percent less new visitors. Rightmove’s lead in absolute visits to its web site is growing.

Rightmove’s traffic lead over its next closest rival remains strong and fundamentally unchanged over a number of years, despite several companies attempting to challenge its dominance.

 
Screen Shot 2020-02-26 at 10.54.14 AM.png
 

Even after Zoopla’s $3 billion acquisition by private equity firm Silver Lake in 2018, and OnTheMarket raising and spending tens-of-millions of pounds to compete with the leading portals, Rightmove’s traffic dominance remains intact.

Zillow vs. realtor.com in the U.S.

Zillow’s arch-competitor in the U.S. market is realtor.com, owned by News Corp. Zillow’s reach is massive: In Q4 of 2019, Zillow’s average monthly unique visitors clocked in at 173 million compared to realtor.com’s 59 million. That lead has remained consistent over a number of years.

 
Screen Shot 2020-02-26 at 10.53.59 AM.png
 

A more granular examination of traffic between the two portals shows the seasonal nature of visits throughout the year, with Zillow maintaining its lead.

 
Screen Shot 2020-02-26 at 10.53.56 AM.png
 

Like its international peers, Zillow’s traffic lead has remained consistent over the past several years. Even after realtor.com’s $950 million acquisition by News Corp in 2014, when the case could be made for further resources being invested into the business, Zillow’s traffic lead has remained steady: Zillow has Millions More Buyers.

REA Group vs. Domain Group in Australia

Australia’s REA Group, which is also majority owned by News Corp, is the world’s most profitable real estate portal. Its lead over rival Domain Group has remained consistently strong over the past several years, and appears to be increasing.

 
Screen Shot 2020-02-26 at 10.54.06 AM.png
 

Domain Group threw off the shackles of a more traditional and risk-averse owner, Fairfax Media, when it was spun out and went public in November 2017. Part of the rationale was to deepen the investment in the business to fully capitalize on the opportunity in front of it. But that deeper investment hasn’t made a dent in REA Group’s traffic lead.

Furthermore, REA Group has consistently turned its traffic lead into a revenue-generating lead as well. Not only are its revenues exponentially higher than Domain Group, but it is growing them faster than the runner-up portal. 

 
Screen Shot 2020-02-26 at 10.53.37 AM.png
 

REA Group’s Millions More Buyers turns out to be more than a slogan; it’s also a valuable service that advertisers are willing to pay a premium for -- significantly more than other advertising channels. There is a premium for advertising a property for sale on the country’s most popular platform.

Happy in Second Place

In 2018, News Corp CEO Robert Thomson, referring to realtor.com, said, "Obviously we’re in a competition, long term, to be number one..."

News Corp has been a major investor in Australia’s REA Group for two decades. More than most, it understands the power of network effects and how expensive and futile it can be to unseat a market-leading portal.

It’s unlikely that News Corp realistically expects to overtake Zillow in the U.S. Attempting to overtake Zillow would be incredibly expensive with an uncertain outcome, and the resulting marketing war would drain huge amounts of cash from both companies.

It’s a similar story in the U.K, with runner-up portal Zoopla’s CEO saying, “We want to be the portal of choice for agents and consumers.” It’s clearly an aspirational goal, but being the portal of choice is difficult when your competition has Millions More Buyers. And so far, over the past three years, Rightmove’s traffic dominance has remained intact.

Being the underdog and striving to overtake the market leader is a great story and good for morale, but it’s an unlikely business strategy.

Misplaced Motivation

Attempting to compete directly with a leading portal is at best expensive, and at worst futile.

The evidence suggests that it is nearly impossible for a runner-up portal to overtake the leader. In fact, there is no evidence that the all-important traffic leadership metric between the top two portals can be budged even a small amount.

Which begs the question: Why are upstart portals attempting to displace leading portals? OnTheMarket launched in 2015 to challenge the duopoly of Rightmove and Zoopla in the U.K. It was founded by a broad consortium of traditional real estate agencies who didn’t appreciate the market and pricing power enjoyed by the existing portals. According to its CEO, it was founded to provide an “alternative search platform” for consumers.

When brokers banded together in the Hamptons to launch a portal to compete with Zillow, the rationale was to “create something that’s owned by the brokers." These organizations, with Millions Less Buyers, are launching portals that are good for themselves, not consumers.

Traffic Growth vs. Revenue Growth

Traffic leadership does not equate to revenue growth. Just because a top portal has a dominant traffic lead over its competition does not necessarily mean that portal can continue to grow its revenues.

Leaders like Zillow and Rightmove have experienced this firsthand. Although both portals retain strong traffic leadership positions, both are experiencing or have experienced a slowdown in residential advertising revenue growth.

 
75069962-6b5a-49b3-8293-88ed21ced86e.png
 

Growth in Zillow’s Premier Agent business slowed significantly in late 2018 and 2019, while Rightmove is experiencing a continued slowdown in its Agency listing business.

 
Screen Shot 2020-02-28 at 10.25.19 AM.png
 

Network effects lead to insurmountable traffic leads for the top real estate portals, but don’t guarantee unchecked revenue growth. To grow, portals still need to provide new, value-added services to customers, and not simply raise prices.

Millions More Buyers

Late in 2019 I sold my house in New Zealand and experienced firsthand the value of Millions More Buyers. The country’s leading property portal, Trade Me, delivered over 10 times the clicks to my property listing than the runner-up portal — 3,100 vs. 300 (read my full analysis).

Attempts to compete directly with the leading portals — from both upstarts and financially strong runner-up portals — have met with limited success. Having deep pockets and a better or differentiated product makes little difference. The ultimate competitive advantage — powered by network effects — is Millions More Buyers. And it turns out that’s what consumers care about most.


Download this strategic analysis as a lovely, nine-page PDF.


The Zillow Revenue Growth Fallacy

Conventional wisdom is that revenue growth is good, and is an important benchmark to measure a company’s success. But total revenue and revenue growth are misleading metrics for iBuying; they’re simply a proxy for how much capital the company has available to purchase houses. 

To increase revenue, Uber needs people to request rides, Airbnb needs travelers to book stays, and Netflix needs consumers to subscribe. iBuyers simply need to buy more houses, and the more houses they buy, the more houses they sell. 

It takes no great skill to enter a market with a lot of money and start buying houses. But it takes a great deal of skill to resell those houses and generate a profit.

Zillow is currently losing money on each house it buys and resells. Overall losses in its Homes segment (Zillow Offers) are mounting: a $100 million net loss in Q4 2019, and a $312 million net loss in 2019.

 
227ed4a8-a2c5-4124-ba0b-a122498d833d.png
 

Looking at the unit economics of each home, which includes the purchase price, sale price, agent commissions, interest expense, holding and renovation costs, Zillow lost over $6,000 per home it purchased and resold. That number has fluctuated over the year, but is rising.

 
792e2ea2-2966-459a-8c10-a92ccf41c997.png
 

(What's driving the loss? Since Q1, the average holding cost per home is up $1,000 and the average interest expense per home is up $1,000 -- both signs that it's taking longer to resell homes.)

After all business expenses are factored in: sales and marketing, technology development, employee salaries, office space -- everything -- Zillow is losing $56,000 for each home it purchases and resells.

 
37c8c3ed-1b9e-4295-8812-daf4664ceb28.png
 

Zillow’s entry into the iBuyer market is still in the early stages. The fact that the business is unprofitable should come as no surprise. The hope -- and it is really just hope at this stage -- is that profitability will come with scale and adjacent revenue streams like title insurance and mortgage.

What’s unclear is not Zillow’s strategy nor rationale for being an iBuyer. Rather, it is why Wall Street, or any other investor or media outlet, is rewarding Zillow for “beating” its revenue guidance. Not only is Zillow able to generate revenue at will by buying more houses, it loses more money with each house it buys. In effect, Zillow is being rewarded for losing more money than originally planned.

The Real Story: Premier Agent Growth

What Zillow should be rewarded for is bringing its Premier Agent Program back to growth. After a precipitous decline in 2018 and all growth grinding to a halt earlier this year, the program is back to growth mode -- albeit small. 

 
8cd65719-fce0-4cdb-bea0-8753941d45fb.png
 

Time will tell if Premier Agent growth will continue as Zillow continues to roll out its flex program, but the early signs are encouraging.

Choose Your Data Carefully

Zillow is investing heavily to grow a new business line, and its ability to sustain losses is reflective of how big it sees the opportunity. My hope -- and it is really just hope at this stage -- is that more sophisticated industry observers will stop putting so much emphasis on pure revenue growth as a metric for success.

A Real Estate Portal's Path to Market Power (A Zillow Case Study)

Zillow’s drive to dominance in the greater New York City real estate market — via rental listings on StreetEasy and its hyper-local Hamptons portal Out East — reveals the path to market power of real estate portals around the world.

The Path to Market Power

All real estate portals follow a simple formula for national domination: acquire listings, build consumer traffic, and monetize. Comparatively, the first step is easy, the second hard, and the third inevitable.

 
ec1c00d2-3ef5-4d16-8cfe-10d28950e510.png
 

Building a huge consumer audience and achieving traffic dominance — which can take a decade — is the critical step. After that step comes power: The power to monetize, the power to push out competition, and the power to force adoption of your platform by recalcitrant customers.

(Upstart portals, such as OnTheMarket in the U.K. and Bomero in Sweden, don’t seem to fully recognize the difficulty of building traffic dominance — frequently believing that “if you build it, they will come.” The importance of acquiring listings is overstated while that of building traffic understated.)

Battleground New York

Zillow acquired StreetEasy, New York City's leading real estate portal, in 2013. Four years later, it announced it would begin charging for rental listings: $3 per listing per day. The rationale was that it would enable StreetEasy to "continue to fuel innovation, technology and resources to support a robust rental marketplace,” but it was also the inevitable outcome of achieving listing and traffic dominance in the market.

The pricing change caused a drop in listings — by some accounts, more than half — but StreetEasy still had the most listings and, more importantly, traffic dominance. This dominance allowed StreetEasy to announce a fee increase of 50 percent to $4.50 per listing per day in 2018. And again a year later, in 2019, StreetEasy announced a fee increase to $6 per listing per day.

 
40031637-6a86-43de-a457-10ac3949ddcc.png
 

There’s a fantastic, self-correcting system at play here — call it a free market — where the platform keeps increasing its prices and its customers keep paying, as long as there’s a positive return on investment. While price rises never feel good, it's hard to argue with, or effectively replace, the advertising reach a portal provides.

Monetization Strategies

Real estate portals around the world employ differing monetization strategies. Outside of the U.S., portals act as the de facto multiple listing service (a national database of all properties for sale) and monetize on a pay per listing basis. Within the U.S., Zillow has adopted both pay per listing (StreetEasy rentals) and, where a multiple listing service is already in place, pay per lead (Premier Agent).

Both strategies have their advantages. In some countries, the average revenue per listing can be thousands of dollars, while the price of a lead can range between $50-$100. The U.S. portals, Zillow and realtor.com, are pushing out a new, success-based fee structure in favor of pay per lead (read my analysis here).

Out East

While the battle for rental listings is well-advanced in New York City, the struggle is at an earlier stage for Zillow’s hyper-local portal in the Hamptons, Out East. Launched in 2018, Out East is in the early stages in the path to market power: acquiring listings and building traffic.

A group of local brokers launched a competing portal, HamptonsRE.com, to challenge the dominance of Zillow and Out East. While not seriously threatened (HamptonsRE.com only has 1,800 listings vs. 2,500 at Out East), it is a critical time in the path to market dominance.

Zillow’s recent decision to move from a pay per listing subscription to a free model for agents is a step backwards in its monetization journey. But it is only a tactical retreat designed to give Zillow a long-term, strategic advantage. Any by allowing agents to post new listings directly — for free — Zillow's move effectively circumvents the brokerages and handicaps their portal.

Key Takeaways

Viewed through a strategic lens, the moves and countermoves in the New York market highlight a number of key takeaways:

  • Traffic is king. Once traffic dominance is achieved, there’s really no stopping a portal from moving down the monetization path at will.

  • Play the long game. In the Hamptons, Zillow’s power gives it the ability to turn off an existing revenue stream in order to solidify its market position for the long term, with the inevitable monetization coming later.

  • Consumer first. An interesting observation: when brokers band together to launch a competing portal, they rarely talk about the consumer. To wit: "The impetus for the site was to create something that’s owned by the brokers." These are companies launching products that are good for themselves, not consumers.

Property Portal Pricing Is Irrational (A Case Study)

I’m selling my house in New Zealand. As part of the process, I'm advertising the property on the major property portals as well as Facebook and Google. It's a perfect opportunity to evaluate the pricing and performance of the various advertising channels, and reveal -- in a real world scenario -- how irrational the system can be.

Background

In New Zealand there is no MLS system that has all properties for sale. That job falls to the real estate portals, and the business model of those portals is pay-to-list. New Zealand (in addition to Australia) is also a vendor-funded marketplace, meaning the homeowner pays the advertising costs, not the real estate agent. And for this transaction, I'm using a Tall Poppy real estate agent, the company where I’m an independent director.

Cost per Channel

When listing my house, I was presented with several advertising options. Trade Me (where I used to work) is the leading real estate portal and realestate.co.nz is the #2 portal. Facebook and the Google Display Network (GDN) are alternative advertising options, and in the world of real estate portal strategy, I’m curious to evaluate their effectiveness (i.e. are they truly competition to the portals?).


There is a significant cost difference between the #1 and #2 portal; Trade Me is over five times more expensive, but is it five times as effective?

Clicks to Listing

The easiest measure of advertising effectiveness are clicks to the property listing. In this case, as is the case with many real estate portals around the world, the top portal is absolutely dominant. At the time of analysis, Trade Me generated over 10 times the clicks to my property listing than the runner-up portal -- 3,100 vs. 300.


(It's worth noting that the Tall Poppy web site generated more clicks for my listing than the #2 portal, reinforcing the continued importance of a real estate agent's web presence to advertising listings.)

Cost per Click

To measure the overall cost effectiveness of the advertising options we review the cost per click.


Trade Me, the top portal, is not only the most effective but also the most cost effective -- by a wide margin. While Trade Me is over ten times more effective than the runner-up portal, it is only 5.5 times more expensive.

Assigning a value per click of $0.30 (the blended average), Trade Me delivered $936 of value for $549, while the runner-up portal only delivered $89 of value for $99 -- a negative return on investment.

It turns out that Facebook is a legitimate advertising channel, but it doesn’t come close to replacing the portals as the primary advertising channel -- in terms of clicks and cost effectiveness. GDN is simply not cost effective.

Findings

Real estate, and real estate advertising, is a non-rational system. Decisions are made based on emotions, not facts. And this transfers to the world of real estate portals and pricing strategies.

A portal's pricing doesn’t always align with its effectiveness. There are more systems at play that influence -- and restrict -- a portal’s pricing strategy, namely the risk of alienating customers by aggressively raising fees, and pressure from competitors.

For the time being, the top portal in each market -- Zillow, Rightmove, REA Group, ImmoScout, Trade Me -- commands a dominant position. Being the place where "everyone goes to search for property," even with alternate options, most often yields exponentially more effective results than the competition.

How serious are Zillow and Redfin about iBuying?

In the past year, two of the U.S.'s leading portals, Zillow and Redfin, have launched iBuyer businesses. Zillow's entry was, in part, a response to an existential threat to its business model, and much of the value it may derive is not from buying and selling houses at all, but by generating valuable seller leads (watch my video presentation). Which begs the question: How serious is Zillow about being an iBuyer?

Opendoor's 3x advantage

The best way to compare seriousness is actual market traction and purchase volumes -- putting your money where your mouth is.

In the first seven months of 2019, Opendoor continues to be the clear leader in the iBuyer space as measured by home purchase volume. Opendoor has purchased nearly 10,000 homes, around three times the volume of Zillow.

 
1cf2adb5-b7c0-46a2-abdb-ec4351101ef4.png
 

On average, Opendoor is purchasing around 1,400 homes per month (as an aside, a recent Opendoor commercial stated the company buys a home every 34 minutes -- or around 1,300 per month). Again, this number is about three times the volume of Zillow for the first seven months of 2019.


However, Opendoor's volume advantage is eroding over time as Zillow's activity accelerates. In January, Opendoor purchased 4.7x the volume of Zillow, but that is down to 2.4x in July. Zillow is closing the gap (especially in the last three months).

 
e7b38fb1-9ea5-4880-8f82-1e2435445ba8.png
 

The magic number in all of this appears to be 3x: year-to-date in 2019, Opendoor is about 3x ahead of Zillow in terms of home purchases. But Zillow is catching up.

Available firepower to purchase homes

Another way to judge a company's level of seriousness about iBuying is how much debt it has available to purchase homes. Each of the major iBuyers has secured massive amounts of debt, but some have secured more than others.


Once again, the magic 3x number appears: Opendoor has three times the debt available to purchase homes compared to Zillow. So it is no surprise that it is purchasing three times the volume of homes.

What about Redfin?

Readers may notice Redfin in distant fourth place in many of the charts, which, again, is an indicator of seriousness about iBuying.

Opendoor has 30x the debt available and has purchased nearly 40x the homes compared to Redfin in 2019. On average, Opendoor is purchasing around 1,400 homes per month, compared to Redfin's 36 homes per month. Redfin is an iBuyer in the same way I'm a basketball player. Both statements are technically true, but neither of us are anywhere close to the big leagues.

Differing strategies and motivations

Opendoor's entire business model revolves around buying and selling as many homes as possible. At scale, it becomes a powerful business. Zillow, on the other hand, may want to moderate its home purchases to achieve a scale where it maximizes seller leads. As I've said before, Zillow has the potential to make more money with less risk by monetizing seller leads.

Zillow's purchase rate (the amount of homes it buys compared to the total number of offer requests it receives) has consistently hovered around 2 percent.


Zillow is expanding fast to catch up to Opendoor, but it may have different motivations in doing so. Zillow's buying activity in Phoenix, for example, has plateaued since January of 2019. Is it taking a well-earned breather, or is 100 homes a month all it wants (or needs) to buy?


The evidence suggests that Zillow is serious about being an iBuyer and a major player in the space. But its motivations, and the question of why it wants to be an iBuyer, may differ significantly from other iBuyers.


Check out the part of my Inman Connect presentation where I talk about Zillow's pivot to iBuying, and the value of seller leads.

Realtor.com’s slow descent to irrelevancy

With the rise of iBuyers as a powerful new starting point in the consumer journey, realtor.com is yielding the strategic advantage to arch-rival Zillow. Lacking an iBuyer strategy for the past year, realtor.com has fallen further behind in terms of delivering value to consumers and agents. Multiple options to enter the space are available, but the clock is ticking for realtor.com to execute strongly and maintain relevance in a rapidly evolving industry.

Power at the top of the funnel

One of the topics I discussed in my recent Inman Connect presentation was the power companies have at the start of the consumer journey. Real estate portals around the world derive and maintain their dominant positions because they are a consumer's first stop in the home buying and selling process.

In the days before the internet, real estate agents were the starting point. With the launch of Zillow and its Zestimate, portals became the popular starting point for consumers. Opendoor and iBuyers shifted the dynamic by offering instant offers on homes, attracting consumers. Today, a number of iBuyer aggregators and real estate agents are fighting to attract consumers by incorporating instant offer services. I explain further in the quick video clip below.


In some markets, up to 40 percent of serious home sellers are requesting an instant offer before listing their home! Instant offers are becoming the new Zestimate -- the new, natural starting point for determining a home’s value. And because of this, they are also an existential threat to portals.

The value of seller leads

The iBuyer business model generates a ton of high-intent seller leads: consumers who are interested in moving and request an offer, but don’t sell their home to an iBuyer. In the last three months alone, Zillow generated 69,000 offer requests but only bought 1,500 homes. The remaining leads can be distributed to real estate agents -- a valuable source of new business.


Today, Zillow Offers is active in 11 markets. Once it expands to 20 markets, Zillow could generate close to 500,000 seller leads annually -- a number that will increase as its national roll-out continues.

Zillow and realtor.com’s traditional lead generation businesses are built around buyer leads. iBuying has become the holy grail of seller leads: popular with consumers, valuable to agents, and of generally high quality. Over time, these leads will become a valuable source of new business for real estate agents, and an additional revenue driver for Zillow.

Using rough estimates, it's clear that the profit potential of seller leads far outweighs that of buying and selling actual homes, with considerably less risk for Zillow.


Real estate agents partnering with Zillow receive valuable buyer and seller leads. The same partnership with realtor.com yields only buyer leads.

Strategic advantage: Zillow

Each day, Zillow continues building its sustainable competitive advantage by strengthening its leadership position in consumer’s minds as the place to go for an instant offer. Simultaneously, Zillow generates tens-of-thousands of valuable seller leads for its agent customers each month -- a service which realtor.com does not provide.

For a real estate portal’s two most important audiences -- consumers and agents -- Zillow is highly differentiated while realtor.com lags behind.

Realtor.com needs to provide an iBuyer service -- but does not need to buy and sell houses directly -- to compete with Zillow. The logical entry point is a partnership with a national iBuyer (and that iBuyer, by the way, needs an inexpensive source of leads just as much as realtor.com needs an iBuyer service).

Until realtor.com unveils a coherent iBuyer strategy, it will remain at a growing disadvantage to Zillow, and risks further irrelevancy in the evolving battle for consumer eyeballs.


Check out my entire Inman Connect presentation, "iBuying Disrupted: Battle of the Behemoths."

iBuying is Zestimate 2.0

When Zillow launched in 2006, its Zestimate was its claim to fame.

The Zestimate was a lead generation tool that attracted consumers by giving them a starting point for determining what their home -- or any home -- is worth. It was online, it was fast, and it was easy.

Flash forward more than a decade later, and online valuation tools are a commodity. There are dozens of web sites that will determine a home's estimated value. Zillow’s unique advantage has diminished.

Zillow's strategic necessity

I believe Zillow's guiding strategic principle is that it must be consumers' first destination in the home buying and selling process. Zillow's sustainable competitive advantage lies in its massive audience and strong position at the start of the consumer journey.

In the past, other listing portal competitors were relatively undifferentiated. Zillow has been the clear market leader, and there was no credible threat that could unseat it from its powerful position.

However, the entry of iBuyers with a service that made instant offers on a home – online – was novel and compelling, just like the Zestimate in 2006. Suddenly, more and more consumers were beginning their home selling process not on Zillow, but on other web sites like Opendoor and Offerpad. This was a key existential threat for Zillow.

The iBuyer business model is Zestimate 2.0 – the natural starting point for determining your home’s value. What’s more accurate than an actual offer on your home?

Mass-market appeal

Opendoor's long-term vision is that every home owner will request an instant offer before selling their home. It's a natural starting point: It's easy, it provides value, and there's no commitment. What better way to value your home than an actual offer?

While Zillow only purchases around three percent of the offer requests it receives (that number is higher for the other iBuyers), a very large number of consumers are requesting offers each month. In established markets like Phoenix, anywhere from 25–35 percent of active home sellers request an instant offer before selling their home. The numbers are BIG.

 
fa500a88-4c85-4fd6-96d0-93b0e00cfe93.png
 

Given the growing mass market appeal of an instant offer (tens of thousands of requests each month) and the simplicity of the process, it's no surprise that Zillow launched its own iBuyer service.

Strategic implications

If you're in the business of providing consumers an estimate of the value of their home, the bar has just been set higher. The inherit power and appeal of the iBuyer model is quite clear:

  • Instant offers are simple, easy, and quick. All online.

  • Instant offers are at the start of the funnel -- they attract consumers at the start of the home buying or selling journey.

  • It's a novel concept that satisfies a consumer need, hence the high proportion of consumers requesting offers.

In other words, iBuying is the new Zestimate.

Rightmove's slowing growth: same problem as Zillow, different strategy

Rightmove, the U.K.'s top portal, announced its full-year 2018 results last week.

Why it matters: Not unlike Zillow, the growth in Rightmove's core advertising business continues to slow. The slowdown in velocity reveals the limits and highlights the challenges the business will need to overcome as it looks for new growth opportunities.

Overall revenue grows and slows

Overall revenue at Rightmove grew 10 percent last year -- respectable, double-digit growth, but also the lowest number recorded in its history.

 
68003b2b-ec3c-4731-ba35-b8c32321d00d.png
 

Rightmove's core revenue driver is its Agency business, which accounts for over 75 percent of total revenue (concentration risk!). Annual growth continues to slide over time. The 8.7 percent growth is the lowest number recorded, and reflects the growing difficulty the business has in charging its customers more money for the same service.

 
24da7cd0-4e58-4be7-8481-a5648324c8cf.png
 

Nearly all of Rightmove's growth is coming from price increases (average revenue per advertiser, or ARPA), as opposed to new customers. The amount that Rightmove is able to squeeze out of its existing customers is slowing over time.


Controlling expenses

Historically, Rightmove has demonstrated incredibly disciplined cost control. By managing its expenses, Rightmove is able to maintain its phenomenal 76 percent profit margins.


But while good for the bottom line, controlling expenses too much can limit the ability of a business to invest in future revenue streams.

One way Rightmove maintains its margins is limited headcount growth. In 2017 (which was a transition year when revenue growth slowed considerably as new pricing was rolled out), the business only added ten new hires. In 2018, Rightmove added sixteen new hires.

 
7c320a2d-8179-4360-ac67-d41138b89415.png
 

Strategic implications

While facing similar challenges, Rightmove's strategy stands in stark contrast to nearly every other major real estate portal around the globe. Zillow and REA Group spent tens-of-millions of dollars to acquire mortgage businesses, Scout24 acquired a finance comparison business for over $300 million, realtor.com acquired Opcity for $210 million, and Zoopla acquired a range of adjacent businesses for half-a-billion pounds.

The real estate portal business is evolving, moving closer to and getting involved in more parts of the transaction. But Rightmove has remained steadfast and stationary in its solitary focus (more on this in my Future of Real Estate Portals Report and 2018 Global Real Estate Portal Report).


Rightmove's revenue growth slowdown may sound similar to Zillow (as I wrote about last week), although the slowdown is less pronounced and immediate. But the trend and concern is the same.

Both portals are facing slowing growth in their core businesses. Zillow has invested heavily in new business lines (mortgage, rentals, Zillow Offers, and lead qualification to name a few) and appointed a new CEO, while Rightmove hasn't -- its eggs are still in the same basket.

Zillow's New Strategy: Insights, Implications, and Analysis

Last week, Zillow announced a major strategic shift: Along with a new CEO, it made clear that its top focus is its Zillow Offers iBuyer business.

Today's email covers the highlights of that announcement. Additionally, next week I'll be holding a 60-minute webinar that dives deep into the strategy, numbers, and implications of Zillow's latest move.

Screen Shot 2019-02-25 at 7.39.23 PM.png

Premier agent growth grinds to a halt

The most striking statistic from Zillow's results is the lack of projected growth in its flagship, billion-dollar premier agent program (which accounts for 67 percent of its revenue). Guidance for the first quarter of 2019 is only 1.5 percent -- a steep decline from past quarters.


And on a full-year basis, Zillow projects its premier agent program will grow at 2 percent -- a flattening from past, double-digit growth.


Both of these projections come on the back of difficulties rolling out new premier agent products focused on lead quality over quantity.

But what's most striking is the suddenness of the decline. Going from double-digit to flat growth in the span of a year is significant. More than rollout issues, I believe Zillow has reached the upper limit of what it can charge agents for leads. Which is what's driving such a significant shift in strategy.

Expensive homes and a longer hold time

Last week I wrote about Zillow's unsold inventory in its Offers program, and the significance of longer hold times. The latest data highlights the same challenge.


The homes Zillow sells are less expensive: an average sale price of $292,000. However, the houses it holds in inventory are considerable more expensive, with an average value of $320,000.

This data point matches up exactly with the latest data from Phoenix, which shows a considerably higher average purchase price for Zillow compared to the other iBuyers.


The more expensive the home, the higher proportion of unsold inventory. It takes longer to sell more expensive homes, and it looks like Zillow is more than dabbling in the expensive end of the market. This is a key metric to watch!

Profit projections

Zillow released a detailed financial breakdown for its Offers business, including initial profit margins on its sold homes. Adjusted EBITDA, which backs out a number of costs including stock-based compensation, shows a per-home profit margin of 0.6 percent, lower than the stated goal of 2–3 percent.


(As a form of employee compensation, I believe stock-based compensation should be included in a true EBITDA calculation, so I've provided both options above.)

It's still early days, but this benchmarks current performance compared to where the business needs and wants to go in the future.

Strategic implications

I believe Zillow's guiding strategic principle is that it must be consumers' first destination in the home buying and selling process. Zillow's sustainable competitive advantage lies in its massive audience and strong position at the start of the consumer journey.

Think of this latest move as "Zestimate 2.0." The original Zestimate gave consumers a fun and helpful starting point when thinking about moving or buying a house. Now that online valuations are a commodity, Zillow needs to up the game: Instead of an estimate of value, how about an actual offer on your house? It's a compelling consumer proposition -- even if it simply serves the same purpose as the original Zestimate (attracting consumers at the start of the journey).

There's a whole lot more to discuss! If you want to listen and watch as I dive deep into the subject, register for next week's webinar.

Zillow Offers' most important metric


Later today, Zillow will announce its fourth quarter and full year 2018 results. Its activity as an iBuyer continues, and it recently overtook Offerpad to become the second-largest iBuyer in Phoenix. But my attention is focused on one key metric: Zillow's ability to quickly sell houses.

Why it matters: Zillow's goal is to hold houses for an average of 90 days. Any successful iBuyer needs to hold houses for as little time as possible, otherwise unsold inventory builds up, finance costs rise, and the whole model starts to blow up.

Overall activity grows; #2 in Phoenix

Zillow's overall iBuyer activity continues to grow, both nationally and in Phoenix (its biggest market). Based on the total number of homes purchased and sold, Zillow overtook Offerpad to claim the #2 spot in Phoenix for the month of January. Zillow is -- for the moment -- the second-largest iBuyer in the important Phoenix market.


Buying more than it's selling

While Zillow's overall activity continues to rise, its purchases are quickly outpacing sales. This is to be expected in the early months of a new market, but it's now eight months since launch. This is creating a growing inventory of unsold homes: around 350 in Phoenix as of February 12th.


It's natural for iBuyers to buy more houses than they sell when entering a new market. But over time, this Buy:Sell ratio is a critical metric for any iBuyer. Houses must be sold for the business to work!

Expensive homes, longer hold time

There are early signs that Zillow may be having difficulty selling houses. For iBuyers, time is money. The faster they can turn around and sell a house, the better.

The magic number for total holding time is around three months; Opendoor and Offerpad hold for between 80-100 days. Zillow currently has around 350 unsold houses in its inventory in Phoenix. Of those, it appears that around 110 homes have been owned for more than three months.

Part of the reason Zillow appears to have longer holding times may be the price of the homes it is purchasing. On average, it is buying more expensive homes than the other iBuyers in Phoenix.


Nationally, Zillow has purchased over 700 homes with an unsold inventory of over 500 homes.


The more expensive the home, the higher proportion of unsold inventory. It takes longer to sell more expensive homes, and it looks like Zillow is more than dabbling in the expensive end of the market.

Strategic implications

The key metric to watch is how well Zillow can sell its houses. Buying is relatively straight-forward; only once a house is sold is the entire business model complete.

To succeed as an iBuyer and appropriately manage its risk, Zillow needs to hold its houses for a minimum amount of time (on par with the other iBuyers), and avoid building up a large inventory of unsold homes.

It's still early days and Zillow has been quite aggressive in growing as fast as possible. But with its one year anniversary four months away, the pressure is on to demonstrate a consistent ability to buy -- and sell -- houses.

REA Group, Domain, and the non-battle for top spot

It's earnings season! In the past week, a number of portals announced their financial results, including REA Group and Domain, the two top Australian portals.

Why it matters: The numbers reveal interesting trends and insights, significantly around the difficulty of building meaningful adjacent businesses, and the non-battle between the #1 and #2 players in various markets.

Adjacent businesses are tough

Like many portals worldwide, REA Group and Domain each launched adjacent businesses, with goals to expand along more of the transaction, reduce consumer friction, and capture more revenue.

But as I've written before, the businesses have very different strategies. REA Group acquired a majority stake in an existing mortgage broking business, while Domain launched a number of joint ventures and partnerships. Different strategies, different outcomes.

REA's finance business continues to chug along, building revenue and generating meaningful earnings ($5.8 million EBITDA over the last six months).


By comparison, Domain's adjacent businesses (finance, insurance, and utility switching) generate similar revenues but with continued -- and mounting -- losses. The latest six months show a loss of $4.3 million.


REA's strategy is delivering a positive financial impact, while Domain's businesses are still in a heavy investment phase after more than a year.

The "battle" between #1 and #2

The battle between the #1 and #2 portal in each market is fascinating, and Australia is no exception.

One metric to compare portals is overall revenue generation. In general, the #2 portal generates between 25 and 40 percent the revenue of the leader (read my portal report), and that number doesn't fluctuate over time. In fact, in the case of REA Group and Domain, the leader is growing faster than the number two.


Domain is the underdog in Australia, and the evidence suggests it will remain that way. Overall situational awareness is important: It would be a mistake to assume Domain will overtake REA in any capacity.

U.K. portal wars -- what's changing?

Along the same lines, the real estate portals in the U.K. recently released traffic figures for the start of the year. It offers yet another fascinating glimpse into the competitive tension between top players -- and the complete lack of movement.

The figures released are for January 2019. And while the absolute numbers are generally rubbish, it's the comparison between portals and the year-on-year growth that's insightful.


Rightmove's numbers have hardly changed, and the delta between the number one and two is still the same. For all the investment on product, marketing, and inventory -- the all important consumer habits haven't shifted.

The variable, however, is the upstart portal OnTheMarket (read my past analysis). OTM has raised over £30m and is aggressively spending on marketing in order to drive traffic to its site. Its traffic has doubled since last year -- but does it matter?

For all of the tens-of-millions of pounds spent to build an alternative to the established portals, what impact is it having after launching four years ago? Zoopla's traffic is marginally down, but it reports that leads are up over 30 percent. The top two portals are equally and exactly as dominant as they were a year ago.

Strategic implications

There are a number of key takeaways for portals around the world:

  • Launching successful adjacent businesses is hard. It takes an incredible amount of investment, and there are a variety of execution strategies.

  • The evidence doesn't suggest that the #2 portal can overtake the leader -- let alone make a dent in its leadership position. It's not a horse race; it's static trench warfare.

  • Trying to launch a new portal and compete against the leaders is at best expensive, and at worst futile. Consumer habits are hard to change.

Zoopla's private equity strategy shift

Zoopla recently announced that it has removed all non-property advertising from its listing pages. This is one of several significant strategy changes after its acquisition by private equity firm Silver Lake.

Why it matters: The benefit of being a private company is that Zoopla can be more aggressive, focus on longer-term opportunities, and be less sensitive to a stock price that focuses on short-term earnings growth. This move is an example of that strategy in action.

The advertising revenue dilemma

A number of real estate portals generate revenue from non-property advertising on their listing pages. Zoopla's move puts it in line with arch-rival Rightmove by banishing banner ads from listing pages.

Note: REA Group and Domain do not have advertising on featured property listings, but do have non-property advertising on "normal" listings.

Note: REA Group and Domain do not have advertising on featured property listings, but do have non-property advertising on "normal" listings.

Banner advertising can be an important source of revenue for portals. However, it comes at the expense of the user experience. If a visitor clicks on a banner ad, their attention is diverted away from the property listing, reducing its effectiveness.

Often times user experience loses out to finances, especially for publicly listed companies under pressure to deliver revenue growth. And given that core revenue growth is slowing at a number of mature portals, the decision is even harder. But for a private company that's focused on the long-term opportunity, the decision is easy.

A shift in strategy

Aside from jettisoning nearly its entire management team, Zoopla has been up to quite a bit post-acquisition; there is the appearance of a significant change in strategy.

Zoopla's aggressive diversification strategy has been a leading factor making it unique in the world of real estate portals. It's been a world leader in acquiring adjacent businesses to dramatically grow revenues (for more on this, check out my 2018 Global Real Estate Portal Report).

274af871-ee65-4308-8ad8-fa224d17114c.png

The company's narrative has centered around a cross-sell strategy, where acquisitions are deeply integrated across Zoopla's network of web properties.

I've questioned the effectiveness of the cross-sell strategy, most recently in my Future of Real Estate Portals Report. The evidence didn't suggest a runaway success when it came to integration and cross-sell synergies.

Notably (and here's the big strategy shift), Zoopla's new managing director recently stated that, "Going forward, the former comparison and property businesses of ZPG will be managed largely separately, but we will continue to achieve synergies between the two wherever it is appropriate and relevant.”

To me, that sounds like a "back to basics" approach with a deep focus on the core product: tools for agents with a fantastic consumer experience. Cross-sell synergies and deep integration across the portfolio are taking a backseat.

Which is an interesting development for Scout24, which recently purchased financial comparison site Finanzcheck for $330 million, and Domain, which has been running the Zoopla diversification playbook for some time. Oops?

Strategic implications

Public companies that are focused on short-term revenue growth are at a distinct disadvantage to private companies backed by private equity. And private equity is getting more involved in the sector:

  • General Atlantic acquires a majority stake in Hemnet, December 2016.

  • Silver Lake acquires Zoopla for £2.2 billion, May 2018.

  • General Atlantic invests $120 million in Property Finder, November 2018.

  • Apax Partners offers $2.5 billion NZD for Trade Me, December 2018.

  • Rumors circulate that several private equity firms are looking at Germany's top portal, Scout24.

It's going to be difficult to compete with private equity-backed portals given their fundamental advantage: they can be more aggressive, focus on longer-term opportunities, and be less sensitive to a stock price that focuses on short-term earnings growth.

Trade Me's private equity adventure

In recent weeks, Trade Me, New Zealand's leading classifieds and marketplace portal, has received two, multi-billion-dollar buy-out offers from private equity firms.

Why it matters: There is a growing trend of private equity getting involved in portals around the world, which allows these businesses more freedom of action as private companies -- but with significant change.

Private equity and portals

Trade Me is New Zealand's leading portal, with property, automotive, and jobs classifieds and a general marketplace business. I worked there as head of strategy between 2012 and 2016.

British firm Apax Partners and American firm Hellman & Friedman have both offered around $2.5 billion NZD for the business, a 25 percent premium to the existing share price.

This news follows several other examples of private equity getting into the (property) portal business:

  • General Atlantic acquires a majority stake in Hemnet, December 2016.

  • Silver Lake acquires Zoopla for £2.2 billion, May 2018.

  • General Atlantic invests $120 million in Property Finder, November 2018.

Slowing growth

Since its public debut eight years ago, Trade Me has grown revenues 100 percent and net profit 39 percent.

Revenue growth has slowed over the years, especially recently, in a story reminiscent of Rightmove's growth dilemma.

aa867808-133d-4951-a42d-4820dcbd5c1a.png

The stock price has seen a steady rise with its ups and downs, but has been relatively flat since 2017.

In August of 2018, Trade Me announced a special dividend to return $100 million in capital to investors. This comes on top of the normal dividend, which represents around 80 percent of profits. Returning capital at that scale can be a signal that the company has run out of ideas.

Many businesses believe it is more beneficial to reinvest profits to improve efficiency, expand reach, create new products and services as well as improve existing ones, and further separate themselves from competitors.

Like Rightmove, Trade Me is in a difficult position. With growth slowing, it is less likely to make big investments for fear of depressing earnings and upsetting investors. It's a delicate, public-company balance. Enter private equity...

Upside potential, with change

Private equity invests in businesses for one and only reason: to make money. It's clear that these P.E. firms have evaluated Trade Me's business and believe there is significant upside potential under new ownership and management.

But significant growth comes with significant change. When Silver Lake acquired Zoopla in the U.K., nearly the entire executive team was let go as part of the restructuring. It's the same story in Sweden, when General Atlantic appointed a new management team after acquiring a majority stake in Hemnet.

Strategic implications

If consummated, a private equity takeover of Trade Me would have a number of implications for the business, competitors, and the entire online ecosystem:

  • A private ownership structure will allow Trade Me to be more aggressive, focus on longer-term opportunities, and be less sensitive to a stock price that focuses on short-term earnings growth.

  • Private equity firms demand a return on their investment, and this transaction will be no exception. Expect costs to be trimmed, earnings maximized, and a more aggressive posture on pricing and monetization.

  • If you're competing with Trade Me, expect a dramatically different business to emerge that's tougher, less conservative, and more willing to throw its weight around.

Trade Me has long had a friendly, home-grown feel in New Zealand. New owners -- and new demands on the business -- may change the equation.