The DelPrete Probability Paradox


There is an inverse correlation between how likely something is to occur and how much attention it gets – a phenomenon a friend has dubbed the DelPrete Probability Paradox.

Why it matters: This leads to attention being focused on the highly exciting, yet least likely scenarios, which dilutes focus and clarity while creating noise and distraction. 

  • Getting informed and being entertained are two separate things; boring headlines don’t sell papers.


Real estate is rife with possibility – news headlines and conference agendas are packed with topics that exist in the realm of the possible and plausible, but not necessarily probable.

  • Will AI replace agents? What will happen to interest rates? How will the commission lawsuits change the industry?
     

  • The reality is that no one knows, and the most probable outcomes are slow, incremental deviations from the current state, not radical changes.


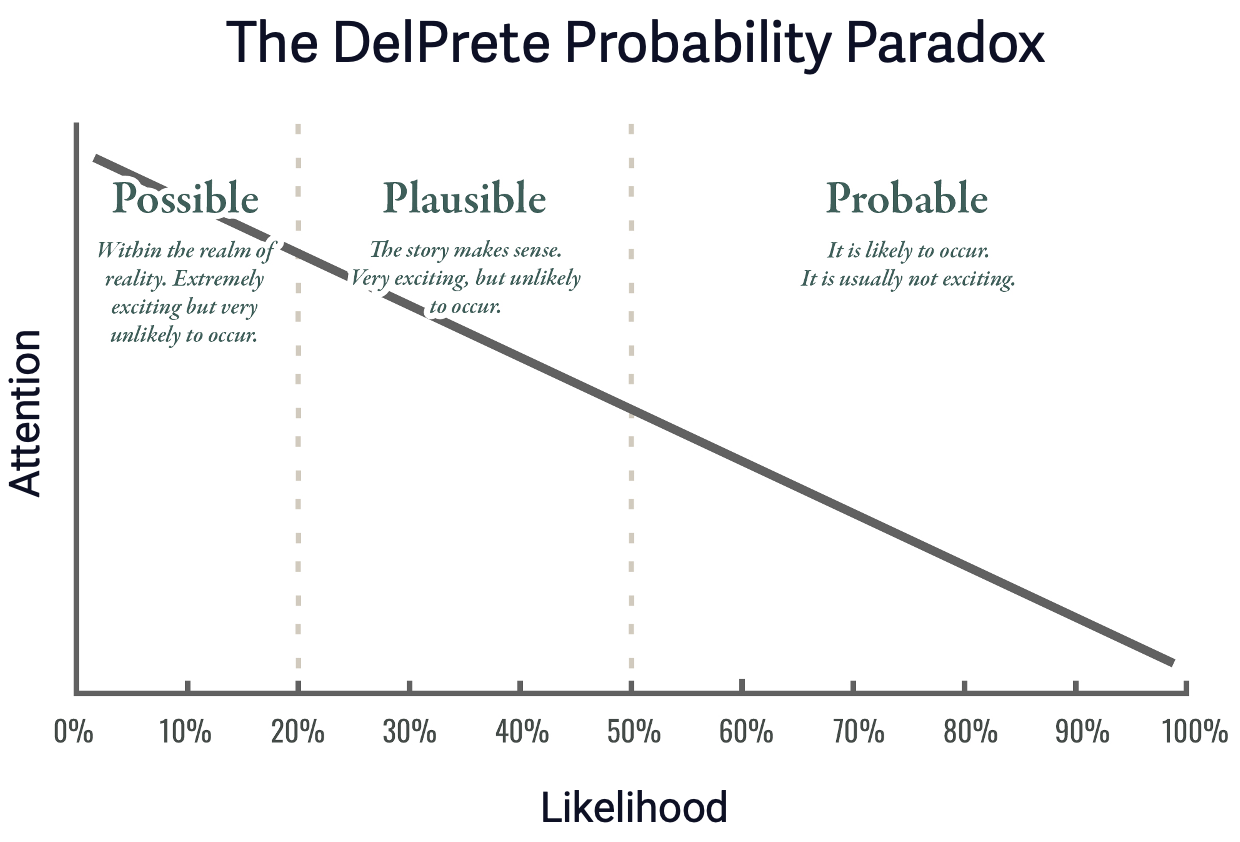
Probability revolves around the existence of data, facts, and evidence – the more we know, the more certain the predictions.

  • The least likely events – the possible – generally exist in a reality light on facts and flush with speculation. 
     

  • Facts are important; they form a trajectory of likeliness – plotting them over time and triangulating data points can identify likely outcomes.


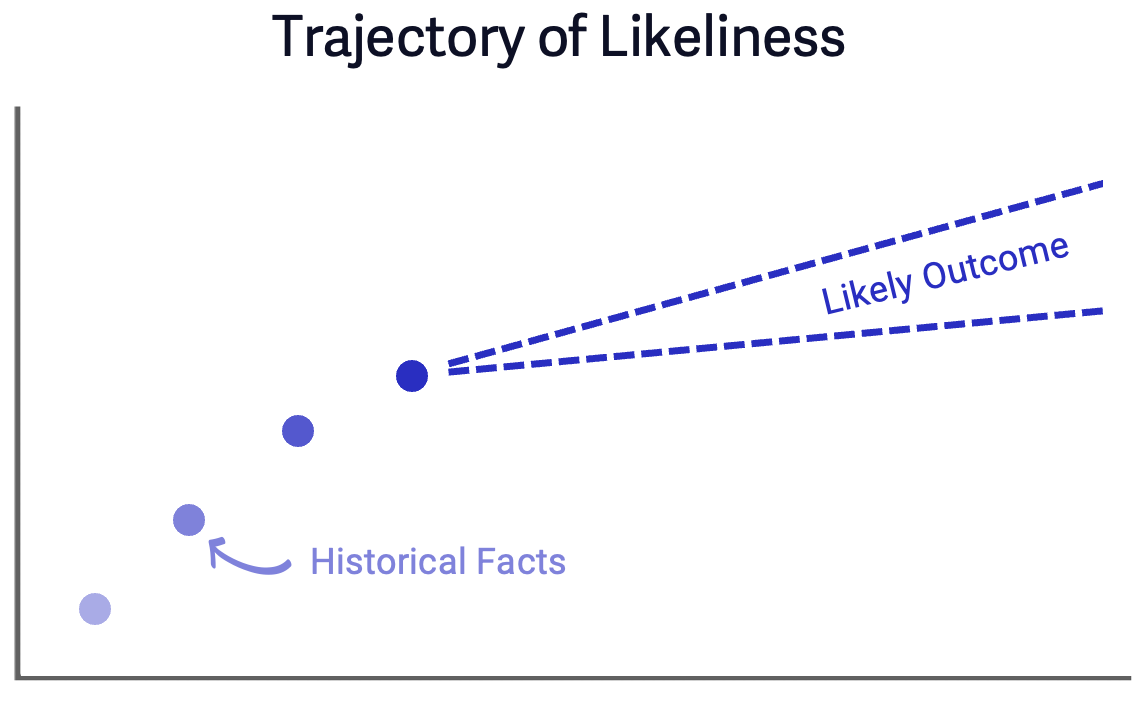
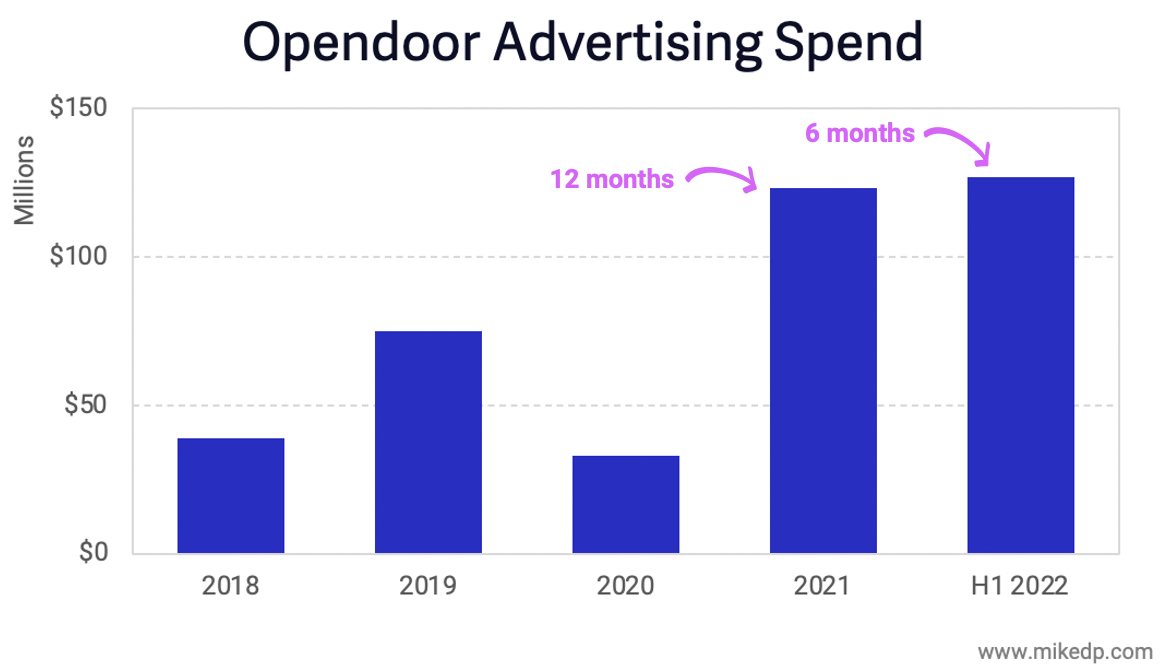
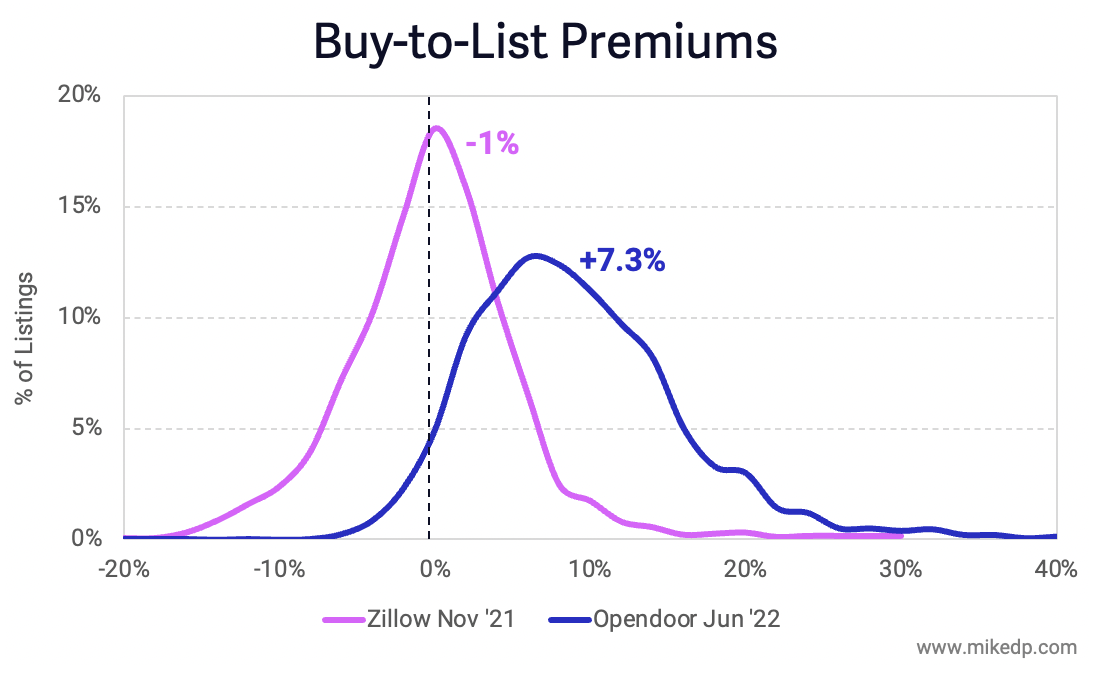
For example: Opendoor’s IPO prospectus presented a very plausible argument supporting its ability to attach adjacent services to a real estate transaction.

  • The company asserted that because it had success attaching title & escrow services to its sales, it would be able to attach other adjacent services like home loans.
     

  • The story made sense – to those outside of the industry – but in the end it didn’t work and Opendoor shut down Home Loans. Plausible, yes, but not probable.


Inertia rules: Newton’s First Law states that an object in motion will stay in motion unless acted upon by an outside force – in other words, systems tend to remain constant.

  • Consider the percentage of homeowners that use a real estate agent to sell their home: even after the introduction of Zillow, Opendoor, and billions of dollars in venture capital pushing alternative models, it remains at a 40 year high.


Speculation is running high with the recent NAR settlement; my thoughts were summed up in this Bloomberg article.

  • "Right now, everyone is turning this ruling into what they want it to be,” said Mike DelPrete, who teaches courses on real estate technology at the University of Colorado Boulder. 
     

  • “Some people are saying not much is going to change. Others want the story to be that it’s a seismic shift for the industry.  The whole thing is being driven by fear and uncertainty.”

The bottom line: Don’t confuse news with entertainment – news is meant to inform, entertainment is meant to distract. 

  • Making smart decisions requires cutting through the noise and gathering evidence, pattern matching, and distilling insights.
     

  • But it's easy to get distracted, which is the crux of the DelPrete Probability Paradox: the less likely something is to occur, the more attention it gets.

Profitability as Proxy for a Healthy Business Model


In 2023, the largest, publicly-listed real estate companies had another unprofitable year with over $1.1 billion in losses.

Why it matters: Profitability is an important metric – it’s a proxy for a healthy business model that has product market fit, is financially viable, and can generate returns for shareholders.

Dig deeper: Net Income (or Loss) is the standard, GAAP-friendly, apples-to-apples method to report a company’s overall financial profitability (or lack thereof).

  • Of all the public companies in the real estate ecosystem, eXp Realty was closest to profitability in 2023, while Compass and Opendoor had the largest losses.


Net Margin is a company’s net loss proportional to its revenue – losing $100 million is different for a company with $1 billion in revenue compared to a company with $100 million in revenue.

  • Net margin is an illuminating measure of a company’s business model; how effective is it at generating profits for shareholders? Is the company a cash generator or a cash incinerator?
     

  • eXp once again comes out on top, but the outlier is Redfin, which, proportional to revenue, was significantly less profitable and less capital efficient than its peers.


The Net Income of the “biggest losers” is being dragged down by large stock-based compensation expenses (compensating staff with stock options and grants).

  • In 2023, Zillow had $451 million in stock-based compensation expense, Compass $158 million, and Opendoor $126 million. 
     

  • These equity awards are a non-cash expense, but they do have a cost: diluting shareholders.


With exponentially higher stock-based compensation expense than any other company, Zillow is the noteworthy outlier in the chart above.

  • Without it, the company would be materially profitable (along with eXp Realty and Real).

Net loss per transaction is another method to highlight business model efficiency, similar to OpEx per transaction.

  • The low-fee brokerages, with lower operating expenses, and Anywhere with its large franchise network, have the smallest net loss per transaction.
     

  • Note: for Zillow, I’ve assumed 3 percent of 4 million transactions.


Throwing Opendoor into the mix highlights the inherent challenges of iBuying: comparatively, and in the current market, it’s a much less profitable business.


The bottom line: Profitability is not the same as cash flow; unprofitable businesses are not necessarily losing money or at risk of going bankrupt.

  • But it is a valid measure to consider when evaluating the merits of a particular business model – eventually, a business needs to make money.
     

  • For the time being, the most profitable – or least unprofitable – companies are traditional brokerages, especially cloud-based ones, while the disruptors and tech companies continue to struggle with sustained profitability.

Opendoor Recalibrates to a New Environment


Opendoor is rapidly recalibrating its business to a new environment: operating expenses have been cut in half while purchase volumes are down to levels not seen since the pandemic.

Why it matters:
A sustainable future for Opendoor revolves around tight cost control and operational efficiency, reducing customer acquisition costs through partnerships, and finding the right balance between offer quality and purchase volumes.

Opendoor’s monthly purchases
have dropped eightfold, to levels not seen since the early days pandemic.

  • The company has gone from purchasing 160 homes per day in June 2022 to purchasing less than 20 homes per day during the first three months of 2023.


Opendoor is purchasing fewer homes by choice – and doing so by offering less competitive offers to homeowners (offer quality).

  • This creates a greater “spread” and improves Opendoor’s ability to resell the homes for more on the open market, giving it a buffer against future market uncertainty – and exposure to profitable upside.
     

  • For example, in the Zillow + Opendoor seller options marketplace, Opendoor’s cash offer is usually considerably lower than Zillow’s estimated market value.


This quarter, Opendoor invented a helpful new financial metric, Adjusted Operating Expenses, which excludes variable costs related to selling a property: broker commissions, holding costs, and transfer fees and taxes.

  • What it reveals is Opendoor’s fixed operating expenses, a helpful measure when thinking about cost control, expense management, and operational efficiency. 
     

  • The net result is clarity around Opendoor’s recent cost-cutting: fixed operating expenses are down $100 million, or 50 percent, from Q2 2022, driven through a reduction in advertising spend, layoffs, and other cost-cutting measures.


Opendoor invested $200 million in advertising during 2022, including a significant shift to brand marketing (Opendoor’s marketing team visited my class this semester).

  • But in a shifting environment, Opendoor has slashed its advertising spend by half during the first quarter of 2023 compared to the same time last year.


A side effect of this shift is skyrocketing customer acquisition cost (CAC), as measured by total advertising spend divided by the number of homes purchased in a period.

  • Compared to 2022, Opendoor’s CAC has tripled to $16k during the first quarter of 2023 – a very unsustainable number in the long term, but one reflective of sustained brand marketing coupled with markedly fewer purchases.


The bottom line: With $1.3 billion in cash, Opendoor has the time and space to retreat, regroup, and realign the business to not only stem its losses, but position itself for future growth.

  • The evidence shows that Opendoor is making significant changes to become a more efficient operation.
     

  • Just cutting expenses at the current purchase volumes is not a sustainable strategy – but it is an important first step as the company reorients for the future.

'Go Big or Go Home': Opendoor's High-Stakes Game of Disruption


Opendoor recently posted its Q4 financial results, revealing mega losses alongside early signs of a possible turnaround.

Why it matters: In 2022, Opendoor experienced an absolutely devastating test of its business model – a worst case scenario event – and survived. 

  • The damage was brutal in terms of financial losses, but the company is still around and operating, whereas most companies would have succumbed to this type of existential event.

Behind the numbers: Opendoor posted a net loss of $1.4 billion in 2022, on top of already sizable historical losses.

  • Opendoor, and many other venture-funded disruptors, are burning billions of dollars to grow new business models – and the lack of profitability just doesn’t matter.
     

  • The most noteworthy fact is that Opendoor lost $1.4 billion in 2022 and is still operating (albeit with a new CEO).


Cash is king: Manufactured financial metrics aside, Opendoor has plenty of (but not unlimited) cash reserves.

  • Opendoor ended 2022 with $1.3 billion in cash, cash equivalents, and marketable securities – down from $2.2 billion at the beginning of the year.
     

  • That’s cash burn of $934 million – massive losses, but a scenario that Opendoor was able to weather without raising additional capital (or going bankrupt).

Like many companies, Opendoor is racing to cut its operating expenses as quickly as possible.

  • In November, it laid off about 18 percent of staff, and just recently announced that it had reduced its run-rate expenses by approximately $110 million.
     

  • Operating expenses are trending significantly lower – a positive sign for a company looking to conserve cash (note: sales, marketing and operations flex up and down based on the number of home sales).


The focal point upon which the future of the business rests is when Opendoor will turn the corner and stop selling homes for a loss.

  • Homes that Opendoor purchased in Q3 and Q4 are performing much better, with positive gross margins.
     

  • Yes, but: The first homes to sell always have the best gross margins – over time, with price reductions, gross margins fall – as expertly illustrated by Datadoor.io.

What to watch: Cash, cash, cash – Opendoor’s future as a going concern rests on its ability to fund loss-making operations.

  • With $1.3 billion in the bank and the worst behind it, the company appears to have plenty of runway.

The bottom line: Opendoor is playing a high-stakes game of disruption. 

  • With billions in the bank and billions in losses, the company is living by the creed, “go big or go home.”
     

  • After experiencing its single largest challenge in a challenging history, Opendoor persists – which may be the biggest takeaway from a brutal year.

Opendoor Slows Home Acquisitions Amid Strategic Shift


After a brutal Q3 in a rapidly shifting market, Opendoor has significantly slowed down its pace of home acquisitions.

Why it matters: Profitable or not, an iBuyer must buy homes to generate revenue and remain relevant.

  • Opendoor's drop in purchase volume was rapid and extreme, but not dissimilar to changes in the past.

  • Opendoor has demonstrated an ability to quickly ramp up and down -- a sensible feature, and not a bug, of iBuying.


Lower purchase volumes mean less homes coming to market, resulting in fewer sales generating less revenue.


But Opendoor's bigger challenge is being able to resell its homes for a profit.

  • It's difficult to imagine a sustainable business model selling homes for less than it bought them for, regardless of fee.
     

  • The rubber hits the road with Opendoor's buy-to-sale premium, and the following chart from Datadoor.io shows that, improving purchase cohorts or not, Opendoor continues to sell homes at a loss.


A four year view of the same buy-to-sale premium, this time from YipitData, shows that Opendoor is well and truly in uncharted territory (and not in a good way).


What to watch: With a rapidly changing market, reeling from unprecedented financial losses, and operating under new leadership, Opendoor is undergoing a transformative moment in its history.

  • It appears to be buying fewer homes while shifting towards more asset-light models, such as Opendoor Exclusives and Power Buying (Buy with Opendoor and Opendoor Complete).
     

  • All of which raises an interesting side question: If Opendoor is buying significantly fewer homes and is guiding more consumers to its Power Buyer products, why would Zillow want to partner with them?

The bottom line: Homes are the fuel that powers the Opendoor machine.

  • As Opendoor dramatically slows down its purchase of homes, it will lose less money — but it also loses its ability to make money.
     

  • Think about it: If a coffee shop loses money on each coffee it sells, the solution is not to sell less coffee; it’s figuring out a way to sell coffee profitably. 

The Race to Cut Costs


Across the real estate industry, companies are racing to cut costs in the face of a significant market slowdown. 

Why it matters: With dropping revenues, cost control is one of the only levers in a company’s control – and is the key to a sustainable, profitable business.

  • The need to cut costs – and the depth of those cuts – are a function of a company’s overall financial health and business model efficiency.

Some companies, like eXp, have the advantage of a more efficient business model with lower operating expenses (OpEx).

  • Compared to its peers, eXp is servicing a disproportionately high number of transactions with relatively modest operating expenses.
     

  • The more traditional industry behemoths, Anywhere and Compass, have a less efficient model with a much higher cost basis (and thus need to cut faster and deeper).


Dig deeper: Another measure of business model efficiency is the amount of revenue generated per $1 spent in operating expenses.

  • Based on this metric, eXp was about three times more efficient in Q3 2022 than its publicly-listed brokerage peers (who are all in the $3–4 range).


Compass has been racing to cut its operating expenses as quickly as possible (it also recently announced a third round of layoffs).

  • Compass is driving to cut its non-GAAP operating expenses by 40 percent, or around $600 million annually.


Layoffs are the most visible way that real estate tech companies are cutting costs.

  • Since June of 2022, Compass has shed around 1,700 employees (40 percent), while Redfin has also cut deep with 2,000 fewer employees (26 percent).
     

  • Many other real estate tech companies have also enacted significant layoffs to cut costs (and in some cases, in order to survive).


What to watch: Among the big brokerages, Anywhere, Compass, and Redfin have already made significant cost reductions, while eXp and Douglas Elliman are under less pressure to cut costs.

  • Cost reductions limit a company’s ability to invest in future growth opportunities (ex: Compass has "paused all expansion into new markets” and Anywhere shut down its cash buying program).


The bottom line: The market downturn is forcing all real estate tech companies to cut their expenses in order to achieve, or maintain, profitability.

  • Unprofitable companies with high cash burn and high fixed costs have no choice but to cut, and cut deep, to survive.
     

  • While other companies operating more efficient, low-cost operating models are under less pressure to make big cuts – and may be better placed to invest in future growth.

One Year Later: Zillow Offers & Opendoor


Last week Opendoor announced that it lost nearly $1 billion during the third quarter of the year — the result of selling too many homes at a loss.

Why it matters: Exactly one year ago Zillow faced a similar situation with its iBuyer business, Zillow Offers — and subsequently shut it down.

  • The cause and effect in each case is similar, with nearly identical financial implications, but the paths forward differ.

Dig deeper: Opendoor’s net loss of $928 million for the quarter is more than double Zillow Offer’s net loss of $422 million in Q3 of last year.

  • It’s a matter of scale: Opendoor sold more than twice as many homes as Zillow (8,520 vs 3,032).

  • The net loss also includes significant inventory write-downs: $573 million for Opendoor and $304 million for Zillow.


On a per home basis, each company incurred similar losses.

  • The write-down per home in inventory is nearly identical, showing that both companies were guilty of “unintentionally purchasing homes at higher prices than current estimates of future selling prices.”


Zillow’s decision to shut down Zillow Offers in Q3 2021 likely protected the company from at least a billion dollars of additional loses.

  • It also returned the company to profitability (on an adjusted EBITDA basis) and removed the uncertainty of wild profitability swings.

  • Meanwhile, Opendoor will endure at least six months of unprecedented financial losses.


(Adjusted EBITDA excludes inventory write-downs, stock-based compensation, and property financing expenses.)

What to watch: Opendoor is making significant changes to reduce its risk in response to the volatile real estate market.

  • It is buying significantly fewer homes, and making lower offers on the homes it does purchase.

  • The company launched a new, asset-light marketplace to connect buyers and sellers, without Opendoor actually purchasing the home (more on this in a future analysis and my upcoming webinar).

  • Opendoor also quietly shut down its entire mortgage operation, Opendoor Home Loans.

Key learnings: It is very challenging for an iBuyer to respond to sudden market volatility, especially changes in home price appreciation.

  • At the desired scale iBuyers want to operate at, the results of downward pricing pressure can be financially catastrophic.

  • Asset-light — not buying the actual house — is taking more prominence in the evolution of the iBuyer business model (and is a key component of the Power Buyer model).

The bottom line: In retrospect, Zillow’s decision to shut down Zillow Offers was the right call: it prevented additional loses, preserved the core business, and positively refocused the company.

  • But while Zillow Offers folded, Opendoor has no choice but to continue on in a challenging and volatile market — making adjustments to its business model as it goes.

Behind the Scenes: Writing a 361-Word Article


Last week I published 2021 Is An Outlier, Not A Benchmark, which turned out to be one of my most-read and most-shared articles of the year. Even though it was only 361-words long, it took a considerable amount of time and energy to create. I’d like to share a behind the scenes look at my writing and research process, and what it takes for me to produce a concise, high-impact analysis.

Step 1: Curiosity
All of my analysis starts with intellectual curiosity. Because I work to my own deadlines and I’m not paid to write, I have the freedom to explore. In this case, I was curious about the housing market. The key questions swirling in my head were:

  • The headlines around the number of houses sold are really negative; is it really this bad?

  • How does 2022 compare to the pre-pandemic years?

  • What else should I know about this situation?

These questions sat in the back of my mind, occasionally entering my consciousness, for months. I would pay more and more attention to the monthly reports from NAR, Redfin, and others, zeroing in on the percentage drops in volume compared to last year. This led to a thirst for more data.

Step 2: Data Collection
All of my work is evidence-based and data-driven, so I knew I needed data. In this case, the necessary data was quite straightforward: existing home sale transaction volumes. Luckily for me, the NAR tracks and reports on this, and after reaching out to them I had my hands on a significant amount of historical transaction data.

For a first, rough analysis, I threw the data into Excel and quickly plotted some charts. At first I was just looking at 2022 compared to 2021, and it was a grim visual indeed. From there I added 2019 and 2020 to build a broader picture. That’s when the first hit of adrenaline came: 2022 was performing better than 2019. I recall looking at the June numbers, and while the media headlines focused on the 15 percent decline in volumes compared to last year, I noticed that the volume in 2022 was exactly the same as 2019.


Step 3: Storytelling & Data Iteration
There was enough initial data to reveal an interesting story. Now I entered a phase of rapid iteration and exploration (more data, more visualizations, more insights). I collected ten years of historical data, back to 2012, and started plotting everything. It turns out that 2022 wasn’t a disaster after all and the monthly volumes fell within the bounds of several past years.


I also made my own estimates for the rest of the year. At the time, 2022 was running around 10 percent lower each month compared to 2019. What if volumes were down 10 percent for each remaining month? It’s rough, but it’s a start, and the result provided a relatively solid estimate on what the remainder of the year could look like.

Meanwhile, at this point I started rolling over various narratives in my head. The first was something along the lines of, “2022 isn’t as bad as it seems.” Yes, the market is slowing down compared to last year, but put within a wider historical context, the market is still active, people are still moving, and, most revealing, transaction volumes are within the bounds of historical averages.

It was around this time that I stumbled upon the answer to my question, “What else should I know about this situation?” The answer was the commission pool, and the insight produced a powerful one-two punch for the entire analysis. Not only was 2022 not as bad as the headlines suggest, but because of rising home prices, the commission pool was going to remain at near-record levels — far above the historical average.


The commission insight revealed itself thanks to my previous work. I had written about how big tech companies were coming after agent commissions in the past, so it’s a topic that occupies a permanent place in my mind. It simply appeared, like many insights do, during one of my mindless moments riding a bike, sipping coffee, driving across town, or hiking in the mountains.

For this article I also created a rough outline. My intention with an outline is to collect and order the various key insights and takeaways as I discover them.


Step 4: Data Visualizations
At this point I was committed to writing and publishing something. The bedrock of my analyses are clear, concise, and compelling charts — the creation of which is a non-trivial task!

It’s at this point I go back to my narrative; if the point is to show that 2022 isn’t so bad in the context of past years, how can I quickly demonstrate that with a clear chart? I started with a line graph showing monthly sales volumes.


The chart wasn’t compelling because the key takeaway wasn’t immediately clear. Back to the drawing board. Only after several iterations did I realize I didn’t need to show monthly volumes; annual would suffice to tell the story. Simplifying the chart helped to sharpen the narrative.


Adjusting a chart’s y-axis is a subtle way to influence how data is visualized and interpreted. It’s a mechanism that I typically steer away from (I’m generally a y-axis starts at zero purist), but in this case, I felt that adjusting the y-axis helped to tell the story in a clear and transparent way.


Step 5: Writing
Sitting down and writing a first draft may be the fastest part of my entire process. By this point, the story feels seventy-five percent clear in my mind. I start by putting all of the graphs I’ve created into one document and order them in a way that tells a clear story. Visuals first, then words.

My writing aims to weave the various data together into a clear and compelling narrative. I always start by describing the key takeaways for each graph.

For me, the most challenging part of writing is the introduction. Robert Caro, one of my favorite authors, distills down an entire book into 1–3 paragraphs before he starts writing. That’s what I endeavor to do; how can I summarize the entire analysis into one sentence? And next, why should someone care?

The writing went pretty quick for this analysis, and my subconscious chipped in with an assist. Over the weekend, the introduction simply materialized in my mind while hiking. I’m grateful for the parts of my brain that continue to tick away on something while I’m otherwise occupied.

Step 6: Editing
Just because I write something doesn’t mean it’s immediately worthy of your time. The entire piece, from data to charts to words, needs to be continually refined until it’s distilled down to its purest form. This process is agonizing and immensely enjoyable all at once, and usually lasts a few days. For this 361-word article, I read, re-read, and revised the draft at least fifty times.

Phrases like “less is more” and “quality over quantity” are often part of my everyday life. My editing goal is the same: to provide the smallest amount of information necessary to make a strong point. In this case, many extraneous sentences (and even a chart) were removed in order to provide a clear and cohesive narrative.

Every single word needs to add something to the analysis. If it doesn’t, I cut. And editing isn’t limited to words; it also includes charts. Adjusting chart titles and adding call-outs are just as important.

The following chart benefited greatly from the addition of several key percentages, explanatory text, and a visual representation of the historical average.


This chart also benefited from a pair of call-outs to reduce the mental load for the reader.


I also realized the commission pool chart would benefit from a clear visual of the additional $25 billion compared to 2019.


While editing, I send multiple draft emails to myself for the full mobile reading experience. It's important to read my drafts as my audience will, and the process helps with editing, readability, and overall flow. For this article, I sent three separate draft emails to myself.

During the editing process I occasionally nerd out a bit. I love grammar and punctuation. There’s an important difference between an en dash and a hyphen. And for this article, the Gregg Reference Manual helped me by providing guidance on how numbers should be written out in sentences. I write out “percent” instead of % on purpose. Three of my favorite books are within arms reach on my desk.


One of the final pieces of editing is getting the heading and subject line right. I don’t write headlines as clickbait — I aim for a brief, compelling summary of the content of my article. In this case, there was much agonizing over individual words: is it “2021 Is The Outlier,” or “2021 is An Outlier?” Details matter.

An important component of my editing process is time. I often do a few editing passes in a row, but then need to let it sit for a few hours while I do something else. There’s no point, at least for me, to power through the process. Once I hit a wall, I need to leave it and come back to it later, which never fails to produce a better outcome with a somewhat refreshed perspective.

Just Press Send
I could continue editing for weeks, but at some point the entire process comes to a close with diminishing returns (and my need to mentally move on to something else). I’m always thrilled to publish a new piece of work and to see the reactions. I enjoy the responses I receive from readers, oftentimes sharing their own perspectives and observations on what I’ve written about.

I enjoy writing. At times, the process can be laborious and mentally taxing, but I’m passionate about the topics I write about. My fulfillment comes from the journey, not the destination. In the end it’s the entire process — from initial curiosity to final edits — that makes me, and hopefully you, a little bit smarter.

2021 is an Outlier, Not a Benchmark


The pandemic years, especially 2021, were a strange aberration where everyone moved, house prices skyrocketed, and nearly every real estate business posted record revenues.

Why it matters: 2022 is constantly being compared to 2021, which was anything but normal, and year-over-year comparisons are painting a deeply negative picture.

Dig deeper: Assuming a fairly conservative 5.15 million existing home sales in 2022, the comparison to last year is a sobering 16 percent drop -- but 2021 is an outlier, not a benchmark.

  • Compared to the historical average of the previous eight years (2012–2019), transaction volumes in 2022 would be down only 0.9 percent.

  • By contrast, compared to the same historical average, transaction volumes were up 9 percent in 2020 and 18 percent in 2021 -- notable outliers.


Comparing 2022's monthly volumes to the historical average reveals recent volume declines that are still significant, but less extreme than a year-over-year comparison to 2021.


But in reality, 2022 has tracked favorably to the historical average and is still in somewhat "normal" territory, even considering the recent market slowdown.


The big picture: Despite dropping volumes, the commission pool -- which fuels the revenue of real estate agents, brokerages, portals, software providers, and more -- is set to be 34 percent, or $25 billion, higher than 2019.

  • This massive increase is being driven by rising home prices.

  • It would take a drop to 4 million existing home sales for the commission pool to hit what it was in 2019: $73 billion.


(These estimates assume 5.15M existing home sales at an average price of $375,000, with a commission of 5.06 percent as tracked by RealTrends. Things may change.)

The bottom line: The pandemic years of 2020 and especially 2021 were radical outliers on a number of levels, real estate being just one.

  • Issues of home affordability, dropping sales volumes, and rising interest rates are all contributing to a challenging 2022.

  • But, if we consider 2021 the outlier and not the benchmark, the market in 2022 doesn't look nearly as catastrophic as headlines suggest.

  • In fact, from a business perspective, there is significantly more money flowing through the system (from commissions) than any year other than 2021.

Opendoor's Buyer Agent Commission Advantage

Even in a cooling market, Opendoor's buyer agent commissions -- the fee paid to a buyer's agent when a house is sold -- remain significantly lower than market averages.

Why it matters: Leveraging its powers of scale, Opendoor is pushing down buyer agent commissions in order to reduce its expenses -- a trend that began in early 2020.

  • Opendoor's buyer agent commissions range from 0.5 to 1 percent lower than the market average (typically, but not always, three percent).

  • At scale, this could save the company over $50 million in commission fees annually.

Dig deeper: The data above, collected from Datadoor.io, looks at over 9,000 listings in Opendoor's 20 largest markets as of September 2, 2022.

  • There were also 226 listings with buyer agent commissions above three percent -- typically on houses that are struggling to sell.


The bottom line: Opendoor is deftly turning the buyer agent commission into a competitive advantage to optimize its business model.

Opendoor Doubles Its Ad Spend


Opendoor's advertising spend has skyrocketed this year, higher during the first six months of 2022 than ALL of last year.

Why it matters: Even in a slowing market, Opendoor's foot is firmly on the accelerator, growing the business and educating consumers at a scale never seen before.

  • In addition to key partnerships, Opendoor is taking its message of a quick, instant sale directly to consumers in a big way.

Opendoor's increased advertising spend is driving an increase in home purchases; it's already purchased nearly twice as many homes in the first six months of 2022 compared to the same time last year.


Opendoor is becoming a real estate advertising juggernaut as it strives to become a leading consumer brand.

  • Compared to the same time last year, Zillow spent $12 million less on advertising (largely due to its exit from iBuying), while Opendoor's ad spend surged $71 million.

  • At its current rate, Opendoor could eclipse Zillow's ad spend in 2022.


The bottom line: At a time when other real estate companies are slowing down and cutting expenses, Opendoor is accelerating.

  • It's notable that Opendoor hasn't enacted layoffs, isn't unilaterally cancelling purchase contracts, and has increased its advertising spend.

  • With a strong balance sheet, Opendoor is taking a long-term view of the business and enthusiastically investing now for future growth.

The Zillow & Opendoor Partnership


Last week, former rivals Opendoor and Zillow announced a partnership to provide Opendoor's instant cash offers to Zillow's audience.

Why it matters: This is a big move for both companies. It reaffirms the continued relevancy of iBuying, gets Zillow back into the seller lead game, and gets Opendoor access to its largest customer acquisition channel yet.

But, why: It's a match made in lead gen heaven.


This partnership gives Zillow the ability to generate and monetize high-quality seller leads (consumers that are considering selling their home), something it lost when Zillow Offers was shut down last year.

  • Historically, Zillow was only able to convert 10 percent of sellers who requested an instant offer; the other 90 percent are high-quality seller leads.

  • Those leads are worth their weight in gold and can be monetized through Zillow's premier agent network (yes, I've been talking about this since 2018).

For Opendoor, this partnership represents an incredible -- and perhaps the industry's largest -- source of customer leads.

  • It extends Opendoor's ecosystem partnership strategy, which includes deals with Redfin, realtor.com, and eight of the top ten homebuilders.

  • The potential benefit to Opendoor is economic: lower customer acquisition costs, which were around $5,500 during the most recent quarter.


Perhaps most important, a Zillow Advisor will be the first point of contact for consumers requesting an instant cash offer.

  • This effectively cements Zillow's powerful position at the top of the funnel with continued, full access to the customer.

  • A Zillow Advisor will be able to discuss an instant cash offer alongside a traditional sale (seller lead), in addition to Zillow Home Loans.

Without the opportunity to upsell adjacencies, Opendoor becomes a fulfillment engine, similar to its other industry partnerships, focused on the core iBuyer transaction (buy, fix, sell).

The bottom line: This deal is both a confirmation of the relevancy of iBuying, and a continuation of that relevancy through Zillow's promotion of instant offers across its massive platform.

  • It puts Zillow back in the potentially-lucrative seller leads business, and gives Opendoor access to millions of potential customers. Win-win.


For more on iBuyers, portals, and the major shifts across the industry, check out my keynote presentation, 2022 WTF, from Inman Connect Las Vegas.

Building a Better Mousetrap: Zillow vs. Opendoor


Opendoor made over two million offers to curious homeowners in 2021, exponentially more than ever before.

Why it matters: This highlights the growing potential of Opendoor's "top of the funnel" customer appeal -- which is beginning to rival Zillow.

  • Opendoor and Zillow are both in the game of attracting consumers and converting them to monetizable customers.

Dig deeper: Of the 2.1 million offers Opendoor made in 2021, it only purchased 1.8 percent, or around 37,000, of those houses.

  • Based on the company's numbers, of those 2.1M offers, five percent, or 105k, represented unique "real sellers." Of those, 35 percent sold to Opendoor.

  • That purchase rate has decreased over time as Opendoor has ramped up the number of offers it makes while automating the offer process.


A low purchase rate does raise questions of product/market fit.

  • Based on the total offers sent out, a very small number of consumers are deciding to sell their home to Opendoor.

  • But of "serious sellers," one in three ain't bad.

Yes, but: Hundreds of thousands of consumers are actively deciding to visit Opendoor to request an offer.

  • Even if Opendoor doesn't buy the house, the company still touches a homeowner during their home buying/selling journey, creating an opportunity to cross-sell adjacent services (brokerage, mortgage, leads to agents).

  • And, as we'll see below, overall customer conversion is on par with Zillow.

Zillow's powerful top of the funnel customer acquisition tool is its web site, which generated an estimated 21M leads in 2021.

  • Of those, 1.4M were "real buyers" and 26 percent of them (360k) ended up transacting with a Zillow Premier Agent.

  • That results in an overall conversion rate of 1.7 percent, exceedingly similar to Opendoor's 1.8 percent.


Zillow's dominance at the top and bottom of the funnel is clear: 10x larger than Opendoor.

  • But surprisingly, Zillow, the decades-old industry heavyweight, is only 10x larger than Opendoor, which has made notable gains.

  • There are variations in conversion rates throughout the funnel, but overall efficacy is nearly identical.

Remember: Zillow is optimized around home buyers, while Opendoor is optimized around home sellers.

The bottom line: With similar conversion rates, neither company has built a better mousetrap, but Zillow's mousetrap is exponentially larger.

  • In terms of customer reach and the sheer quantity of leads generated, Zillow has a huge advantage.

  • But with its ongoing national expansion, heavy advertising investment, and automation of the offer process, Opendoor is making significant gains -- and the growing power of its top of the funnel customer acquisition can't be ignored.

A note on data: The last time Zillow reported the number of leads generated annually was 17M in 2016. My assumption of 21M leads in 2021 is a well-informed estimate.

Opendoor's Buy-to-List Premium Falls Back to Earth


After reaching record levels earlier this year, Opendoor's buy-to-list premium (the difference between the purchase price and current listing price of a home) has fallen dramatically -- a reflection of a rapidly changing market.

Why it matters: The buy-to-list premium is the best leading indicator of iBuyer profitability -- and while it has dropped, Opendoor appears to be deftly riding a dynamic market.

  • As of June 16th, Opendoor's median buy-to-list premium across 2,700 listings was 7.3 percent -- down from a record 17 percent in March.

Opendoor's home sale prices, as measured by the buy-to-sale premium, lags the market by a few months, and, for the time being, remains in very healthy territory.

  • In fact, Q2 is going to be another record quarter for Opendoor, with average buy-to-sale premiums over 10 percent according to YipitData.


A dropping buy-to-list premium is not the end of the world for Opendoor; it's not overpaying for houses or losing money on their resale.

  • Opendoor's buy-to-list distribution curve is significantly better than Zillow's was last year, when Zillow was, on average, losing money on each house resold.


The bottom line: The heady days of record home price appreciation -- the most significant driver of iBuyer profitability -- appear to be coming to a close (for now).

  • A buy-to-list premium of 7 percent is still healthy (and on par with the entirety of 2018 and 2019) -- but anything much lower, for longer, could present challenges.

The Opendoor MLS


Tucked away in Opendoor's recent earnings call was an enlightening statement by its CEO, Eric Wu, which sheds light on its exclusive supply strategy.

Why it matters: Exclusive content is a strategy being driven by VC-funded real estate tech disruptors, with important implications for consumers and a spotty track record of success.

  • A possible endgame for Opendoor is to match exclusive supply with demand directly -- off the MLS -- through an Opendoor ecosystem.


The benefits to Opendoor are clear: avoiding agent commissions, controlling the consumer experience start to finish, and streamlining the sales process.

Opendoor is not alone in wanting to build a supply of exclusive inventory to draw consumers to its private platform.


Compass also uses exclusive content to drive consumers directly to its platform, a clear endgame for the business.

  • Compass encourages sellers to list exclusively and privately on its platform.

  • Nearly a quarter of Compass' current listings are exclusive; a homebuyer has to call a Compass agent for access.


Yes, but: This isn't new.

The rise of exclusive content in real estate risks fragmenting the search and discovery process -- with considerable implications for consumers.

  • Buyers lose easy access to a complete view of the market by being forced to visit multiple sites (or call an agent like it's 1995).

  • For sellers, it fragments and artificially reduces the number of possible buyers, which could lead to less demand and a lower price for a property.

The bottom line: There is incredible value to whoever controls the home search platform. In the U.S., that's Zillow, realtor.com, and hundreds of MLSs.

  • New platforms -- leveraging exclusive content -- are a significant threat to these incumbent platforms.

  • And so far, the benefit to consumers is questionable.


Go deeper: I've previously explored this topic in my Strategic Analysis of The Top Threat to Real Estate Portals. Spoiler alter: It's exclusive content.

This analysis looks at several case studies from around the world.

Opendoor 2022: Can't Stop, Won't Stop


2021 was a record year for Opendoor, and 2022 may be even bigger. To date, Opendoor has exponentially increased its advertising spend and homes purchased.

Why it matters: The latest data reveals a company doubling down on growth, despite rising market uncertainty and the risks illustrated by Zillow's 2021 implosion.

Opendoor's growth, as measured by the number of homes purchased, has materially accelerated.

  • Opendoor's monthly purchase volume is running significantly ahead of last year; March was big and April looks even bigger.

  • The company purchased 2.5x as many homes in Q1 2022 compared to the same time last year.


Opendoor's advertising spend is driving the growth in transaction volumes.

  • The company doubled its advertising spend in Q1 2022 compared to last year.

  • If that spend were annualized, Opendoor would be on track to invest a record $200 million on advertising in 2022.


The increasing advertising spend is causing Opendoor's customer acquisition costs to rise compared to 2021 (as calculated by total advertising spend divided by houses acquired).

  • But customer acquisition costs are lower than Q1 2021, showing improving economies of scale.


The bottom line: 2021 was a record year for Opendoor -- and the evidence suggests 2022 may be even bigger.

  • As a public company, Opendoor needs to demonstrate growth regardless of market conditions.

  • Despite recent profitability driven by record home price appreciation, Opendoor's model only works at scale -- a scale larger than 2021.

  • Opendoor remains committed to making its model work, and in a sense, is just getting started -- by operating at a scale where things get interesting.

Opendoor Set to Cash In from Record Home Price Appreciation


Home price appreciation is through the roof again, and Opendoor's buy-to-list premium (the difference between the purchase price and current listing price of a home) is at record highs.

Why it matters: Opendoor is going to make a lot of money in the first half of 2022.

Dig deeper: Opendoor's houses are currently listed for a median of 17 percent -- or $60k -- higher than what they were purchased for, on average, 72 days earlier.

  • This is based on 1,700 listings as of March 15, 2022 (excluding Texas), and according to YipitData's historical analysis through February, is an all-time high.

  • The distribution across listings shows a significant improvement from the end of 2021 -- and is pushing so high I had to adjust the chart's x-axis.


Buy-to-list is a good leading indicator of iBuyer profitability, and is usually a few percentage points higher than the eventual sales price.

  • Buy-to-list in one quarter generally affects the following quarter: Opendoor's low buy-to-list in Q3 2021 resulted in a low buy-to-sale premium and contribution margin in Q4 2021 (3.3 percent).


Opendoor is going to have a blockbuster Q2 2022 -- contribution margin is on track to exceed 2021's highs of 10 percent.


Yes, but: If Opendoor is the winner here, who is the loser?

  • Opendoor is no different than any other home seller in the market. If the home seller is the winner, the loser must then be home buyers -- scant inventory and rocketing home prices are making homes less affordable.

  • Opendoor is simply riding the market wave, and riding it really well (remember Zillow Offers?).

What's next: What goes up must come down; home price appreciation will slow, and Opendoor will once again need to deftly read the market and adjust its purchasing activity.

  • These extreme market risks are a big reason Zillow exited iBuying.

The bottom line: Opendoor (and Offerpad) are going to benefit tremendously from rising home price appreciation in the first half of 2022.

  • It's worth noting that this key financial driver isn't within Opendoor's control. Wildly rising home price appreciation isn't a business strategy, it's the market.

Big Tech Coming After Agent Commissions in a Big Way

The biggest real estate tech companies — Zillow, Compass, and Opendoor — have set their sights on agent commissions as a source of revenue and profit growth.

Why it matters: Agents remain the backbone of the industry, generating around $100 billion in commissions annually.

  • That commission pool is a rich target for big tech companies to tap into.

Zillow's new strategy (Zillow 3.0: Back to Basics) is centered on extracting an additional $1.5 billion from agents by 2025, for a total of $2.9 billion annually.


Compass wants to pay agents less. In its own words, Compass has a demonstrated track record of "improving economics with agents" of one percent per year.

  • Compass provides multiple slides that highlight its plans and ability to reduce commission splits paid to its agents over time.


In other words, if you're a Compass agent, the company's plan for profitability hinges on reducing your commission split over time. Sorry!


Opendoor continues to use its scale to push buyer agent commissions -- one of its biggest expenses -- lower.

  • In Atlanta, Opendoor has experimented with buyer agent commissions ranging from 1.5 to 3 percent, having finally settled on 2.25 percent.

  • Interestingly (and I don't think I can take credit for this), Opendoor dropped its lowest 1.5 percent buyer agent commission ten days after I published about the iBuyer War on Real Estate Commissions.


Some perspective:

  • Opendoor sold 20,000 houses in 2021. A 0.75 percent savings in buyer agent commissions is about $53 million annually.

  • Compass's medium term goal of a 2.5 percent commission split improvement on its 2021 revenues is $160 million annually.

  • Zillow wants to generate an additional $250–$300 million from agents per year.

Yes, but: These companies aren't simply raising prices; they're offering increased value to agents.

  • Opendoor promises partner agents increased deal flow and less time spent on each transaction.

  • Compass promises its agents increased deal flow and efficiency from its brand and tech platform.

  • Zillow provides agents with exclusive access to pre-qualified buyer leads.

The bottom line: Big Tech has big plans to extract hundreds of millions of dollars from real estate agents in the coming years.

  • Amidst a landscape of new models, disruptors, tech innovation and "super apps," there remains one consistent way to make money in real estate: commissions.