
Growth Machines: Compass, eXp, and the Future of Brokerage
/
The major, publicly-listed brokerages all posted impressive revenue, transaction, and agent count growth in 2021.
Why it matters: In a notoriously slow-moving industry, these are eye-catching gains. Revenue at Compass beat out Realogy's owned brokerage group for the first time.
eXp Realty doubled its U.S. revenue in 2021. For a business already operating at scale, this is a very impressive feat.
By the numbers: eXp Realty rocketed past industry incumbent Realogy in an accelerating growth curve, topping 400,000 transactions in 2021.

Agent counts are driving this growth. Despite promises of disintermediation, disruption and technological efficiency, the agent is still central to the transaction.
Compared to its peers, agent growth at eXp Realty has been jaw-dropping. eXp added more new agents in 2021 than Compass has in total.

The big picture: Amidst the hyperbole of disruption, the future of brokerage is still being shaped by real estate agents.
Brokerages are growing by recruiting more agents. The more agents a brokerage adds, the more that transactions grow.

Agent recruitment is a key competitive advantage for brokerages; Compass and eXp's growth has been propelled by generous financial incentives offered to agents.
Be smart: Perhaps consider Compass' technology platform through the lens of agent recruitment and retention, and its level of investment is understandable.
A note on eXp Realty: The numbers above are estimated for the U.S. market. eXp reports global figures, but also gives the percentage of revenue generated outside of the U.S. I've used that to estimate U.S. agent count, transaction volume, and revenue.
Momentum Builds in Mortgage Disruption
/
Significant changes continue in the mortgage space as portals, iBuyers, Power Buyers, and brokers invest in building end-to-end real estate ecosystems.
Why it matters: Real estate tech disruptors are investing billions to build integrated brokerage and mortgage experiences. These companies employ licensed brokers -- Mortgage Loan Originators (MLOs) -- that occupy a critical position in securing or refinancing a mortgage.
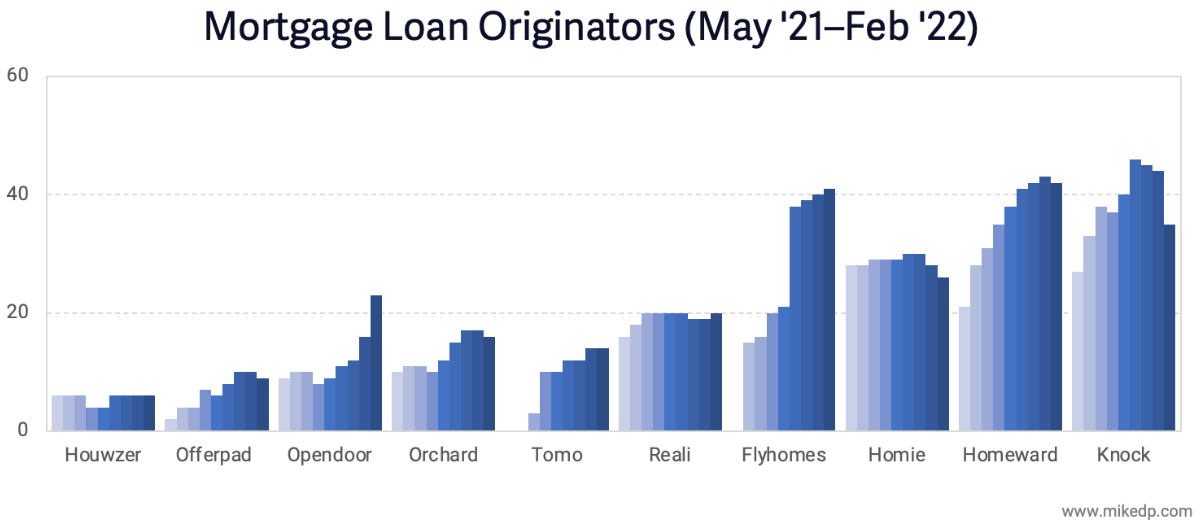
The number and growth of MLOs is an important leading indicator of a company's firepower and strategic intent.
Big picture: Of the venture-backed disruptor pack, the companies with the most MLOs are those attempting to develop a complete ecosystem play anchored around mortgage: Power Buyers.
Homeward, Knock, and Flyhomes are good examples, while Orchard lags due to a slower-growth employee agent business model.

Notable growth in MLOs occurred at Opendoor and Flyhomes, sending a strong signal of intent.
In November 2021, Opendoor acquired RedDoor, a digital-first mortgage brokerage, with 10 MLOs.
In Q4 2021, Flyhomes accelerated its hiring of MLOs to meet current and expected demand.

Comparatively, Zillow has more firepower but has been shedding MLOs since May 2021, with a significant drop in January.
Knock, a Power Buyer, also saw a significant decline in MLOs during January.

Redfin made a huge move in January, acquiring Bay Equity Home Loans for $135 million, adding 485 MLOs to its roster.
This positions Redfin well ahead of Zillow in terms of underwriting capacity -- and is a strong signal of future intent in the space.

Yes, but: All of these companies pale in comparison to the behemoths of the mortgage industry.
Rocket Mortgage (12k MLOs) and Better Mortgage (1.5k MLOs) have both announced plans of their own to expand into the brokerage space.
The bottom line: Mortgage lies directly on the path of brokers, portals, and disruptors attempting to build an end-to-end real estate ecosystem.
Opendoor is clearly ramping up its mortgage resources and ambitions, while Redfin has made a big investment in the space.
Tracking the number of MLOs over time reveals how serious these companies are and their potential to grab market share.
Next Gen Lead Gen
/Next generation lead generation is the most significant business model shift for real estate portals since their birth. It is the evolution towards delivering fully qualified leads with a commission share model, and it accounts for an increasing percentage of portal lead gen revenues -- while bringing them closer to the transaction.
An Emerging Global Trend
The evolution is occurring globally and targets both buyer and seller leads. The key themes include lead qualification and a commission share model (aka success fee).
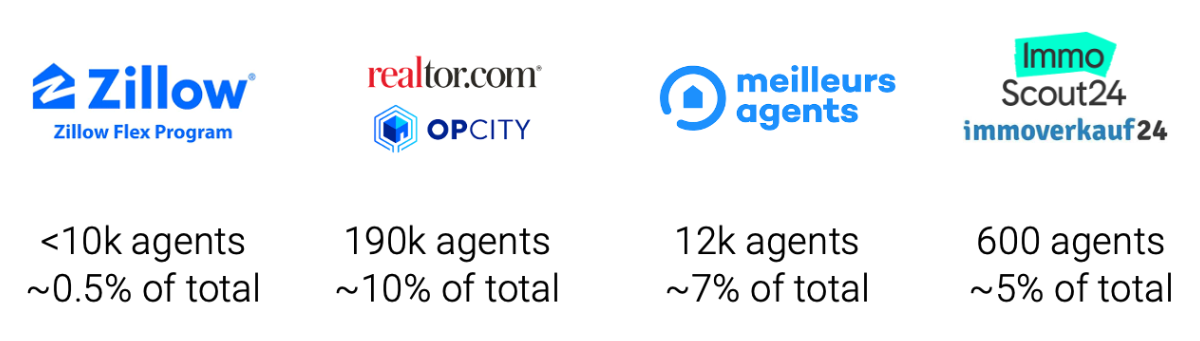
Leading real estate portals around the world have made significant investments into next gen lead gen, including several large acquisitions.

The U.S. portals focus on monetizing buyer leads, while international portals like ImmoScout24 and MeilleursAgents focus on seller leads. The most effective way to reach prospective sellers is with property valuations: “What is my home worth?”
A key element of this model is that leads are qualified before being handed off to a partner agent. Leads are called directly by the portal, typically within minutes of submitting a form.

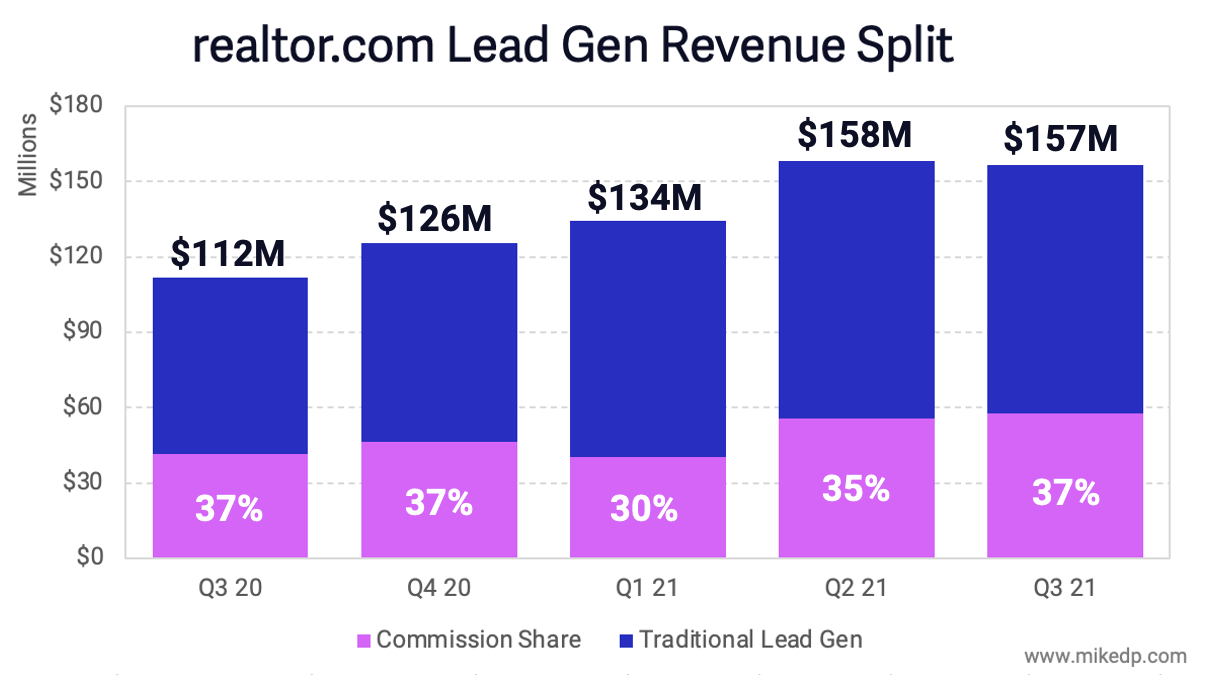
The second key element of next gen lead gen is the use of a commission share, or success fee, model. If a lead transacts, the agent pays a percentage of their commission back to the portal.

The commission share varies by market, but is generally around a third of an agent's commission. And this source of revenue accounts for an increasing share of portal revenue; realtor.com generates about a third of its lead gen revenue from the commission share model, as does ImmoScout24.
A Win for Consumers, Portals, and (some) Agents
Next gen lead gen lays the groundwork for a triple win: the promise of a better consumer experience, less wasted time for agents, and a more valuable product for portals.
The potential downside of next gen lead gen programs lie in their exclusive nature. It's not for everyone; agent networks consist of a small and exclusive group of the total agent pool.
Over the long term, the agents not participating in these programs will receive fewer online leads, and may be at a significant competitive disadvantage in the race to acquire customers. Next gen lead gen is revolutionizing the portal lead gen business model, but it only works for the agents that jump on board.

Next Gen Lead Gen is a major trend discussed in my Real Estate Portal Strategy Handbook.
Check out the free preview of the report.
How Data Can Be Used to Mislead: Compass' Results Told Three Ways
/“In God we trust; all others bring data.” The power of data in evidence-based research is critical, but even data -- used certain ways -- can mangle the truth. As a case study of how data can be manipulated to tell different stories, I examine Compass' recent financial results three different ways.
Method 1: The Annual, Single-Company View
The first method, which is what Compass uses, compares key metrics to the corresponding period one year ago -- annual growth. Compared to Q3 2020 (and remember, 2020 was a pretty weird year), Compass experienced significant growth in revenue and transaction volumes -- up 47 percent and 36 percent respectively.
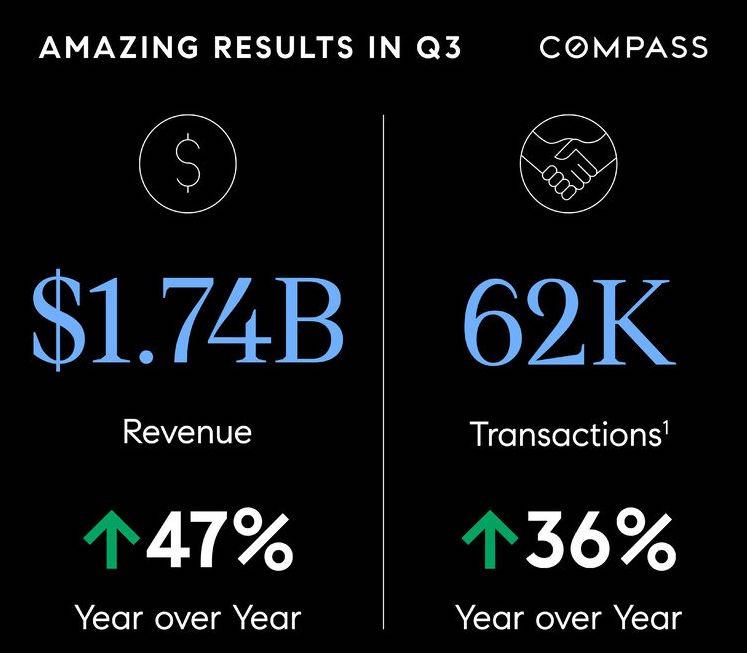
Compass' revenue growth was driven by more transactions, which in turn were driven by more agents (a 31 percent increase in Principle Agents). An annual comparison method accounts for seasonality in the business and is a great metric for companies in a relatively mature state, but falls short without important context.
Method 2: The Quarterly Single-Company View
An annual comparison is tricky for high-growth companies; the numbers are always huge. A granular look over time reveals deeper trends: Compared to the previous quarter, Compass' revenue actually declined, and its guidance for Q4 is a further decline.

Compass is subject to the same headwinds as any brokerage: inventory, seasonality, and agent recruitment & retention. It clearly hit a (seasonal?) peak in Q2, and now the business is slowing.
On a quarterly basis, Compass' losses are also stacking up. After approaching profitability last quarter, the company has returned to a net loss this quarter ($71 million of which is stock-based compensation expense).

A quarterly view over time introduces momentum and trends. It reveals that Compass's growth isn't steady (something that isn't clear with an annual comparison), and that the business appears to be slowing down -- with losses.
Method 3: The Quarterly & Annual Multi-Company View
This method adds additional perspective with the context of Compass' publicly-listed peers. The numbers above lack context; is Compass under- or over-performing in the market?
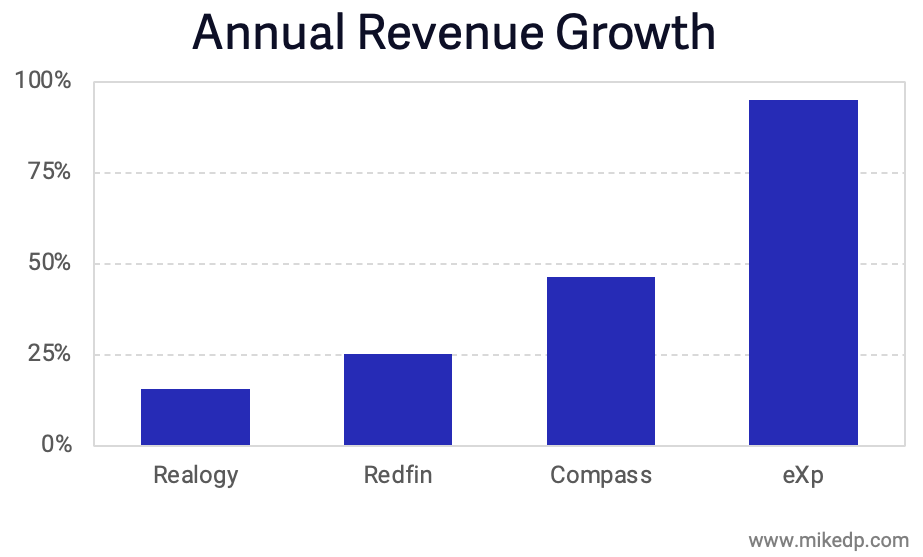
It turns out that on an annual basis, revenue is growing at all of Compass' peers. Compass' growth rate is in the middle of the pack, larger than Realogy and Redfin, but lower than eXp Realty.
On a more granular basis (comparing to the previous quarter), Compass stands out with a revenue drop larger than its peers. As we saw above, something happened in Q3, and Compass' slowdown is more pronounced than any of its peers.

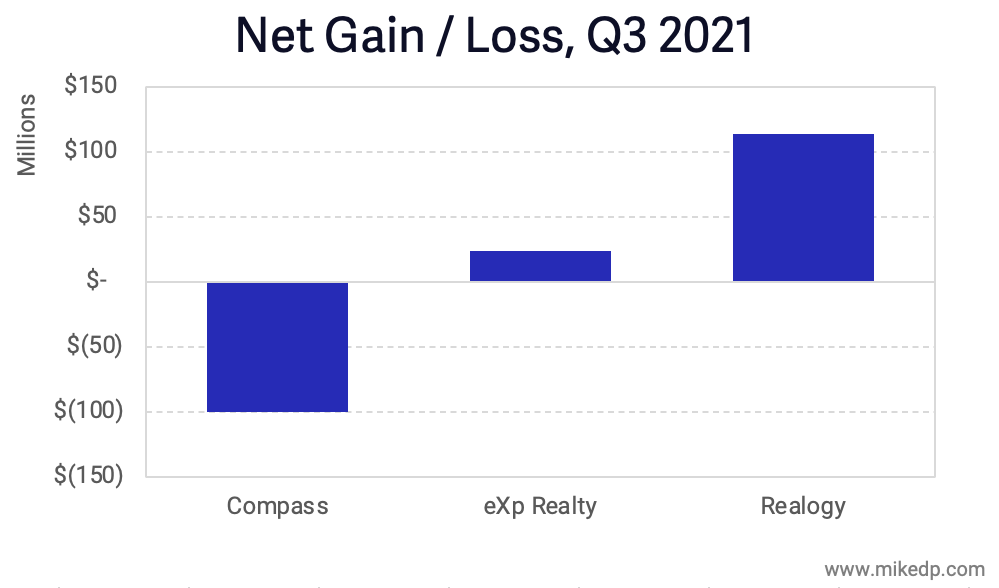
Finally, it's worth noting that Compass is materially less profitable -- unprofitable, in fact -- when compared to its brokerage peers. Realogy and eXp are generating significant net profits, while Compass continues to burn cash.
A peer comparison highlights key business model differences and provides another angle on the recent business slowdown. And while Realogy may be viewed as the less exciting, slow-growth industry incumbent, it runs a sustainable, durable, and profitable business model.
Strategic Implications
There's not one, right way to tell this story. But there's always different angles to consider, and multiple data points to triangulate the truth.
Exploring the complexity of real estate through evidence, context, and storytelling is a passion of mine. It's easy to manipulate the truth, or provide various versions of it, depending on the data presented. The truth is out there -- it just takes a critical eye to find it.
The Real Estate Disruptors Serious About Mortgage — A 10x Story
/Real estate tech disruptors are investing billions to build integrated brokerage and mortgage experiences. Some have more resources than others, but all have the same scaling bottlenecks. And in the end, the biggest disruptors -- and who is most at risk -- may come as a surprise.
The Bottlenecks to Scale
Each company employs licensed brokers -- Mortgage Loan Originators (MLOs) -- that occupy a critical position in securing or refinancing a mortgage. As with real estate, people remain a central component of the mortgage process, and no amount of technology, venture capital, or inspirational vision has yet to replace them.

MLOs are both a key component and a bottleneck for the iBuyers, Power Buyers, and others attempting to attach mortgage to their core services. The speed at which they hire MLOs, and the total number employed, is a reflection of how serious they are and their potential to grab market share.

Homeward and Knock, fresh off big funding rounds, are quickly growing. Newcomer Tomo is moving fast. Notably, the iBuyers remain relatively small. There is no outsize leader...until real estate portal Zillow is added into the mix.

Zillow has nearly 10x the MLOs of its smaller competitors, giving it significantly more scale and firepower for its integrated mortgage plans. Zillow is the top player...until pure play digital disrupter Better Mortgage is added into the mix.

Better Mortgage has raised nearly $1 billion in its quest to disrupt mortgage, and has nearly 10x the MLOs of Zillow. Significant firepower and scale, and clearly the top player...until industry behemoth Rocket Mortgage is added into the mix.

Ten MLOs to ten thousand MLOs. And: The number of MLOs roughly corresponds to closed loan volumes: $1.2 billion for Zillow, $14 billion for Better, and $65 billion for Rocket in Q1 2021.
Who's Disrupting Whom?
Both Rocket and Better recently announced they're hiring in-house real estate agents, which raises an interesting question about who's disrupting whom. Real estate tech companies are going after mortgage, but now mortgage is going after real estate.

These companies all have different approaches, but the destination is the same: an integrated real estate experience that seamlessly combines mortgage and brokerage. And the key execution trends are clear: in-house agents and MLOs, paired with deep discounts for consumers.
Perhaps the true takeaway is that those companies not included on the chart are the ones at risk. Whether it's being initiated from the real estate or mortgage side, both components are being smartly combined to provide an integrated, highly convenient consumer experience. The companies unable to provide that are the ones at risk.
Compass Nears Profitability as it Outperforms Incumbent Peers
/It's earnings season, which means press releases with huge numbers and big percentage gains, but light on helpful context. Compass posted big numbers; its quarterly growth is generally in line with its peers, while its record revenue is the result of continuous incremental outperformance.
Pandemic-Fueled Revenue Leap
Compass experienced a significant increase in revenue this past quarter -- a seasonal uplift fueled by a hot housing market. Compass has a history of large Q2 revenue jumps (delayed by a quarter in 2020 due to the pandemic).

When it comes to a global pandemic and real estate, a rising tide lifts all boats. Many of Compass' publicly-listed peers, including Realogy, eXp Realty, and Redfin, also experienced record breaking revenue growth. The quarterly growth rates follow a similar pattern.

They key is that Compass (and eXp) are outperforming their peers by a few percentage points each quarter -- the highs are higher and the lows not as low. That compounding effect adds up over time, and has resulted in Compass finally surpassing Realogy's brokerage revenue in Q2 2021: $1.95 billion vs. $1.77 billion.

Approaching Profitability (?!)
Compass also announced a net loss of only $7 million -- a huge improvement over past quarterly losses. The improvement was driven by Compass increasing its revenues and gross profit (by a lot) without a corresponding increase in expenses.

Future profitability hinges on more of the same: a favorable real estate market with a high volume of transactions, without a proportionate increase in expenses.
Strategic Implications
Like eXp Realty, Compass' revenue has increased exponentially over the past two years, driven by incredibly favorable market conditions that have benefited all real estate brokerages -- but some more than others.

Huge industry incumbents like Realogy have benefitted the least, while upstarts Compass and eXp have grown the most. Even tech-enabled Redfin, with so much going for it, pales in comparison to its peers.
The hot real estate market has fueled strong growth across the industry. Compass' growth is noteworthy, and demonstrates that while the industry moves slowly, some players move faster than others.
The Rise of Power Buyers
/Following the rise of iBuyers during the past decade, 2021 has seen the emergence and rapid growth of Power Buyers -- companies empowering buyers with services like cash offers, bridge financing, and trade in programs. Like iBuyers, these companies are transaction-focused, but most critically, target buyers instead of sellers.

Power Buyers leverage their balance sheets to purchase homes on behalf of their customers (turning offers into all-cash offers, or as part of a trade in program).
The focus on buyers is achieving a high product/market fit: Orchard and Homeward saw 150%+ growth in 2020 and over 300%+ growth into 2021. With high demand for housing and low supply, buyers need products to stand out from the crowd. Cash offers and trade in programs are providing that advantage.
The Mortgage Advantage
Financial products aimed at home buyers give Power Buyers industry-leading mortgage attach rates. That is in stark contrast to the major iBuyers, who have struggled to attach mortgage.

When it comes to attaching mortgage, it appears to be more effective to target buyers earlier in the process. Which is why the iBuyers are evolving their model to offer cash offer and trade in programs (ex: Opendoor's cash-backed offer).

The shifting landscape is causing disruptors and incumbents to adjust their strategies. Many companies are responding to this shift in consumer demand by launching their own instant offer, cash offer, and trade in programs.
Digging Deeper into Power Buyers
There's a lot more to unpack in the world of Power Buyers. My latest free report goes into this topic in detail, and the following video provides a crisp overview.
The Impact of Compass' Declining Stock Price on Agents
/Compass' stock price has declined significantly since its IPO; it was the worst performing stock among its real estate peers over the past three months. And while stock prices certainly fluctuate, the decline has a significant, real world impact for the Compass agents that participated in its agent equity program.

A Bumpy IPO
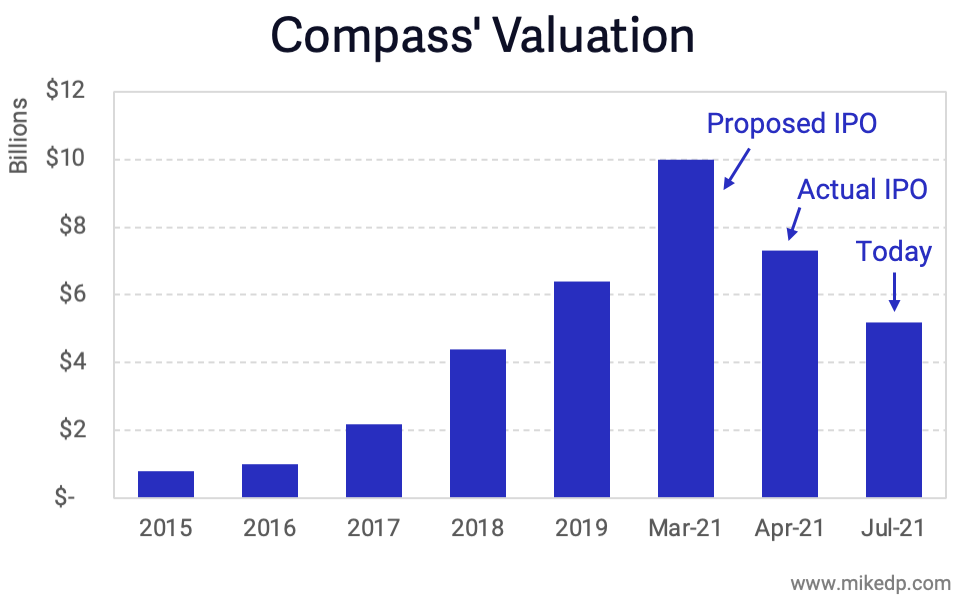
Compass' stock has had a rough ride since its IPO on April 1, 2021. The company originally planned to price its shares between $23 and $26, valuing the company at $10 billion. With muted demand from investors, it revised down to $18 a share with a valuation of just over $7 billion for the IPO.
Compass Stock Price

Compass' stock has generally declined since its debut as a public company. It's currently trading at around $13.30 per share with a market cap of $5.2 billion -- significantly less than its last private valuation of $6.4 billion set by investors in July 2019.
Unlike any of its public real estate peers, Compass is worth less today than it was two years ago -- an outlier in the high-flying world of real estate tech stocks.

The Agent Equity Dilemma
Compass' stock price is especially relevant to agents that participated in its agent equity program, which allows agents to convert a portion of their commission into company shares. Compass agents invested $70 million into this program during 2018 and 2019 (the 2020 figure is unknown).
Any shares issued after July 2019 were valued at the company's valuation at that time: $6.4 billion or $154.26 per share ($15.42 per share after accounting for a stock split).
The point is that Compass stock is worth less today than it was in 2019, meaning agents that invested into the agent equity program since then have lost money on their investment (even accounting for a 10 percent company match).
Strategic Implications
Compass' growth story is impressive, and building a multi-billion dollar business is a noteworthy achievement. There are many individuals and organizations that made lot of money from the Compass IPO. But it's not a linear, upward trajectory to riches, and there are definitely winners and losers.
Stock option programs sound good on paper, but the reality varies. The post-IPO performance of Compass' stock highlights the primary issue with stock as a recruiting tool: it only pays if the stock goes up.
iBuyers Beginning to Target the Northeast Market
/The Northeast is the major population center of the U.S., but has remained untouched by disruptive new models in real estate -- until now. Opendoor, Zillow, Offerpad, RedfinNow, and Orchard are establishing the first footholds in this potentially lucrative market. Traditional agents and brokers have had years to prepare -- are they ready?

The strongest iBuyer markets are centered in the West, Southwest, and South -- basically everywhere except the Northeast and Midwest. These markets, with older housing stock and longer winters, are more difficult to crack.
Major iBuyer Markets
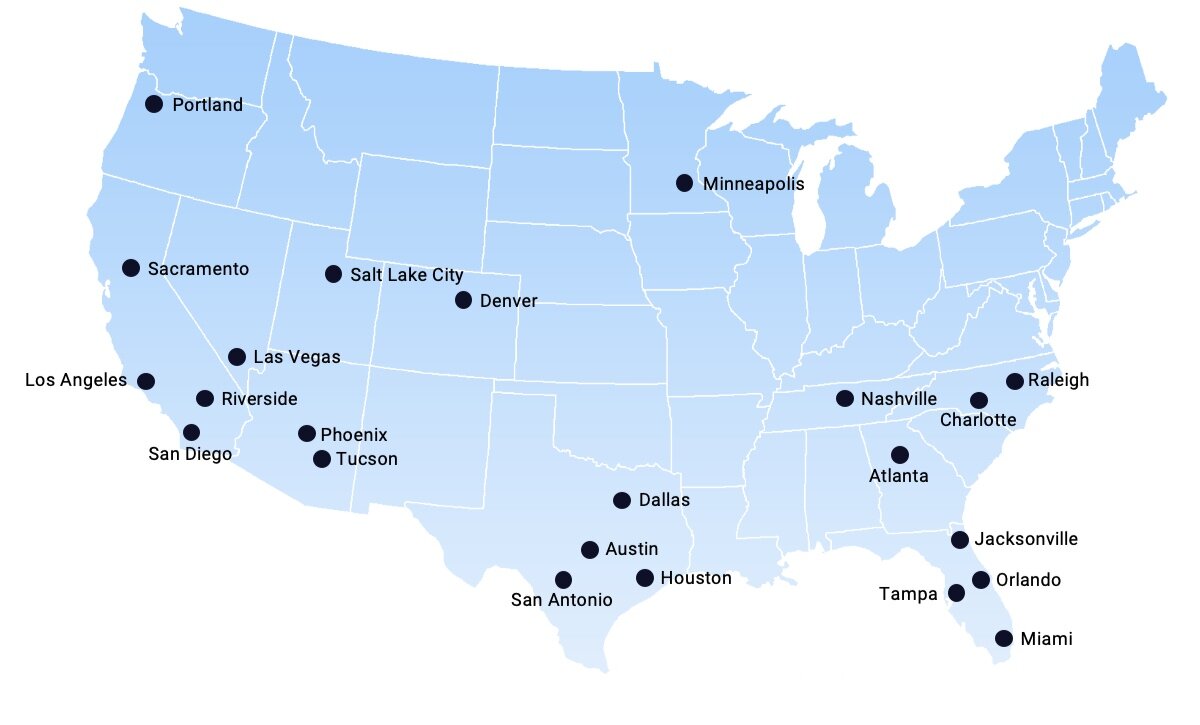
But it's no secret the iBuyers (and other models) plan to enter the Northeast. Opendoor's investor presentation clearly laid out the playbook and plan of attack, which includes expansion into the Midwest and Northeast corridor.
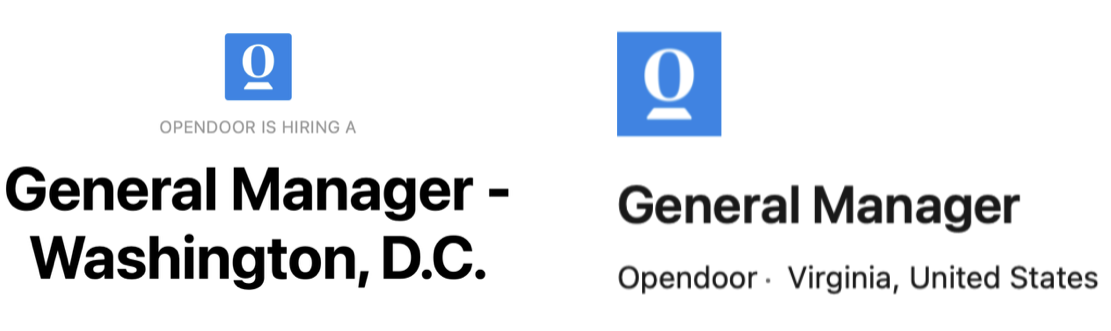
Opendoor's Target Markets

Based on a pair of recent job postings, it appears that Opendoor is starting in Washington D.C., Virginia, and Maryland -- a market that RedfinNow and "Power Buyer" Orchard also entered earlier this year.
In early 2021, RedfinNow was the first iBuyer to launch in Boston. Meanwhile, Offerpad is expanding through the Midwest, recently announcing a launch in Columbus. This sits alongside Zillow Offers' presence in Cincinnati, a market launched in 2020.

Strategic Implications
Traditional real estate agents located in the Northeast and Midwest have had years to watch and learn. Billion-dollar disruptors are coming, featuring new models like instant offers, cash offers, and buy before you sell programs.
The Northeast accounts for 17 percent of the U.S. population, and local realtors can be zero percent forgiven for ignoring the coming disruption. Change is happening (slowly) and smart agents are adapting to that change. No market is immune. What's your plan? (Hint: Compete Where You Can Win).
Compete Where You Can Win
/In the fast moving world of real estate, it’s never been more important to define a crisp and effective strategy. A portion of my work consists of strategic consulting for a range of real estate tech businesses. That experience has taught me a lot, and I can sum up what I believe to be the single most important concept in strategy: Compete where you can win.
A three minute video of me talking about "Compete Where You Can Win."
Find Your Sustainable Competitive Advantage
All of my strategy work — from multi-billion dollar organizations to scrappy start-ups — starts with a somewhat cliche business school phrase: sustainable competitive advantage. This is what sets a company apart from others; the collection of unique attributes that allow an organization to outperform its competition.
In the world of real estate tech, Zillow has its massive consumer audience, Compass has its deep pockets, Keller Williams has its scale, and Realogy has its brands.
Clearly identifying a sustainable competitive advantage — a company’s strengths — is an important first step in an effective strategy. The critical second step is leveraging that competitive advantage directly against a competitor’s weakness or a market opportunity — competing where it can win.
Case Study: Compass
Perhaps the best case study is Compass. Its competitive advantage was capital ($1.5 billion in VC funding), which it used to gobble up market share.
The competitive weakness that Compass exploited was a traditional brokerage’s inability to compete on capital. Competitors couldn’t match Compass’ commission splits, signing bonuses, or marketing support. Unlike its competitors, Compass didn’t need to worry about being profitable, and the company leaned heavily into this strategy to recruit agents and grow its market share. Compass played a game that it, and it alone, could win.
Compete Where You Can Win
What truly sets yourself or your business apart from others? What can you offer that no one else can, and how can you leverage it against your competitor's weak points? It’s senseless to go up against your competitors where they are strongest (although many still try).
Anyone in real estate, from disruptor to incumbent, behemoth to startup, tech company to individual agent, can effectively compete in today's quickly changing market. It all comes down to being smart about understanding your strengths and competing where you can win.
Zillow, Power Buyers, and the Challenge of Attaching Mortgage
/In 2018, Zillow set itself lofty goals when it entered the mortgage business. Three years later, Zillow's actual performance is far, far below its predictions, highlighting how difficult the mortgage space is, not just for Zillow, but for every real estate tech company targeting mortgage as a lever for growth.
Setting High Expectations
Zillow's 2018 Annual Report, released after Mr. Barton assumed the CEO role, clearly set out the company's 3–5 year goals in mortgage:
Mortgages Segment
Zillow Home Loans achieves a 33 percent attach rate to Zillow Offers, up from zero in 2018.
Zillow Home Loans originates more than 3,000 loans per month, up from nearly 4,000 MLOA loan originations in all of 2018.
The 33 percent attach rate to Zillow Offers is down from the lofty 75 percent attach rate quoted earlier by Mr. Rascoff in Zillow's 2018 second quarter earnings call:
"So for anybody who is wondering why we just bought a mortgage lender, just to hit some of those numbers again, at a mere 10,000 homes sold a month from Zillow Offers, a 75% attach rate gets to over $800 million a year of revenue opportunity for mortgage origination.”
Three years and over 10,000 homes bought and sold later, the reality is a mortgage attach rate to Zillow Offers of less than 1 percent.

(Zillow and Opendoor's attach rate is based on the markets where the service is live.)
Zillow's goal of originating 3,000 loans per month, or 36,000 in a year, remains highly aspirational. Loan originations actually took a step backwards in 2019 before rebounding in 2020 due to the pandemic and record low interest rates -- but are still less than 20 percent of Zillow's original goal.

It's worth noting that proportionally, Zillow's purchase volume (versus refinance) has steadily declined from 97 percent in 2018 to 31 percent in 2020 (and down to 10 percent in Q1 2021). The growth in Zillow Home Loans is being fueled by refi.
The Rise of Power Buyers
Ironically, Zillow is attaching more mortgages to Opendoor-owned homes than it is to Zillow-owned homes. Just let that sink in.
This bizarre fact underscores how difficult it is to attach mortgage to an iBuyer home for sale; most prospective buyers are already pre-approved. It's too late in the buyer journey to introduce and attach a new financing option.
Which is why the smart money is on companies -- I call them Power Buyers -- focused exclusively on attracting buyers earlier in the process with products like cash offer and buy before you sell. Examples include Homeward, Orchard, and Knock, and initiatives like Opendoor's Cash Offer and Zillow's video tease of it helping a Zillow Offers seller secure financing for their next purchase.
There are a multitude of companies attempting to sell mortgage and other adjacent services to their customers in an effort to increase profits. For the time being, the Power Buyers are in the lead with mortgage attach rates approaching 80%, with the iBuyers pivoting their models to catch up. Zillow's experience shows that it's a long, slow road, requiring big investment, patience, and a smart, consumer-first approach.
Compass Agents: You Are The Customer
/As a newly public company, Compass faces a challenge to reach profitability. Its latest numbers reveal a noticeable drop in agent commission splits, a reminder that Compass’ path to profitability lies directly through -- and may come at the expense of -- its own agents.
Compass incurred losses of $212 million in its first quarter as a public company, compared to the $270 million it lost in all of 2020. Meanwhile, Compass’ peers managed to turn a profit during some of their best quarters ever.

The $212 million loss includes a one-time expense of $149 million of stock based compensation. Looking at Adjusted EBITDA, where each company backs out various expenses to provide a more favorable accounting of the business, still reveals significant losses -- compared to the healthy profits at eXp and Realogy.

The data reveals a brokerage continuing to lose money, especially compared to its peers, during a booming real estate market. But now that Compass is public, the spotlight is turning towards profitability and leading to an obvious source of additional profit: its agents.
The Agent is the Customer
In the first quarter of 2021, Compass’ agents generated $1.1 billion in revenue and were paid $900 million in commissions (including stock). But the effective agent commission split of 80.8 percent is a noticeable drop from the past year. While its brokerage peers paid proportionally more money to their agents, Compass paid less.

In its public filings, Compass attributes this “favorable decrease” (their words, not mine) to “the change in mix of the commission arrangements we have with our agents” and “changes in geographic mix.” The agent economics are changing in Compass' favor, and Compass is retaining more of the commission.
This dynamic is not unique to Compass, but it highlights the natural tension between brokerage and agent when less money being paid to agents is seen as “favorable” and “an improvement.”
For Compass, a reduction of its effective agent commission -- through a combination of changes in commission arrangements, geographic mix, and increasing technology fees -- of just 3 percent results in immediate profitability.

It's highly unlikely that Compass will drop its agent commissions 3 percent and survive as a business. Agents would simply pack up and leave. But the gap isn't too far and, combined with rising technology fees, represents the fastest path to sustained profitability.
Compass' effective agent commission drop in Q1 2021 is the largest seen in two years. It may be an outlier or it may be the start of a trend, but it remains a key metric to watch going forward. And if you're a real estate agent, this is a gentle reminder to never forget that you are the customer.
A note on data: When calculating Compass' effective agent commission splits, I've included stock-based compensation. For Q1 2021, I've backed out the one-time acceleration of stock-based compensation expense of $41.7 million in connection with the IPO.
The Compass Valuation Quandary
/Compass' recent debut as a public company was a mixed bag. Of considerable note is the current valuation: $6.65 billion, compared to $6.4 billion when it last raised capital two years ago. The tiny gain brings up interesting questions: Why has Compass' valuation not increased more, and how does it compare to its peers?

Compass has a massive valuation, on par with Redfin and dwarfing Realogy. This analysis isn't about the valuation itself, but rather changes in value over time. Often, trends and momentum reveal more than absolute figures.
Between July 2019 and April 2021, many real estate and real estate tech stocks have seen massive gains, even traditional incumbents like Realogy and RE/MAX. However, Compass stands out with a tiny 4 percent gain in valuation over the past two years -- two years which has seen massive growth at the company across all metrics.
Compass has positioned itself on the cutting edge of real estate tech, promising to revolutionize the industry through unprecedented investments in technology. However, the company valuation has hardly budged in two years. Why the disparity?
The valuation discrepancy -- especially compared to its peers -- stands out loud and clear. Investors either significantly over-valued the company in its previous fundraising rounds, or are pessimistic about its growth prospects going forward.
Research note: Company valuations from July 2019 are taken from GCA Advisors research, and for 2021 are from April 8th. All valuations are a like-for-like "equity value." Opendoor's 2019 valuation is from March, the remainder from July 2019.
America's Next Top Real Estate Model: Tracking the Growth of eXp, Redfin, and Compass
/Compass, eXp Realty, and Redfin are three of the largest, fastest-growing brokerages in the U.S. Each operates a traditional brokerage business model and leverages technology as a key competitive differentiator. A deeper look at the rapid rise of each reveals a trio of insightful growth stories — which may very well shape the future of America’s real estate landscape.
The changes to the top 20 U.S. brokerages by transaction count are striking (data courtesy the Real Trends 500). In 2018, the top two brokerages (Realogy and Berkshire Hathaway HomeServices) dwarf the competition; no other brokerage comes close. Fast forward to 2020, and eXp Realty is within striking distance of the top two, followed closely by Compass.
Each business has experienced wildly different growth trajectories. Compare Redfin’s slow and steady growth to the exponential hockey stick curves of Compass and, most impressively, eXp Realty.

The engine room of each company’s growth is driven by agents (as I like to say, agents sell houses, not technology). The corresponding agent count at each company closely mirrors overall transaction count growth. Redfin has far, far fewer agents than its peers, but its agents are exponentially more efficient.

Since 2018, Compass and eXp have grown agent count and transaction volume exponentially, which -- at this scale -- is unheard of, and why each company is so disruptive in the industry.

Reviewing the interesting similarities and key differences between the three companies reveals their different target markets, represented by average sales price. Compass is clearly in the luxury band, while Redfin caters to high priced homes and eXp is closer to the national average home value.

In the end, Compass and eXp are quite similar: fast-growing real estate brokerages fueled by unprecedented agent growth. Both companies leverage cash (or the promise of cash via stock options and/or multi-level marketing) to recruit, and lean on technology as a differentiator.
In 2018, it could have been possible to ignore the companies or dismiss their efforts to grow. But in 2021 they've become too big to ignore, and are cementing -- and growing -- their leadership position in the future of real estate.

Beginning to Unpack the Compass IPO in Four Charts
/At long last, Compass' IPO filings have revealed the financials and other key metrics of the business. This Friday I'll be hosting a paid webinar to fully unpack the filing, along with examining key strategic questions and implications for the business. To start, here's a few key takeaways presented around four charts.
Financials
Compass is unprofitable -- a net loss of $270 million in 2020 -- a result of its operating expenses exceeding its gross profit (revenue after paying out agent commissions). Losses were growing into 2019, and contracted in 2020.

Historically there's been a wide gap between these figures, resulting in massive unprofitability. Last year was an outlier due to Covid-19; Compass saw a surge in revenue during Q3 and Q4, while its expense growth dropped significantly (partially driven by a reduction of headcount, operations & support, and sales & marketing).
Annual Growth and Efficiency
Between 2019 and 2020, Compass did 66 percent more transactions with 48 percent more agents (note: I'm using a midpoint total agent calculation, instead of the smaller Principal Agent figure provided by Compass). The result is an improvement in efficiency: on average, each agent did 12 percent more transactions.

Context: the market was crazy hot in 2020; many agents were doing more transactions. The market as a whole was up 5.6 percent for the year, and December alone was up 22 percent compared to last year. At the end of the day, 12 percent is an incremental improvement, and much of it could be driven by the hot market.
The real key is that the number of Compass employees was only up 29 percent. In other words, Compass was able to support 48 percent more agents and 66 percent more transactions with only 29 percent more employees. That's a promising sign of improving operational efficiency.
Improving Operational Efficiency
Another sign of improving operational efficiency is Compass' total Operations and Support expense ($225 million in 2020) relative to the number of agents and transactions the business supports. Over the past three years, it's gone down, a sign of improving efficiency.

Gross Margins
When all is said and done, the Compass financials are bleak if you care about profitability. One of the biggest challenges is Compass' gross margins -- which are total revenues minus agent commissions and other transaction-related expenses. It's the "net revenue" a business makes before all of its indirect expenses are taken into consideration.

Compass' gross margins are low (and have been dropping over the past few years). Its gross margin is on-par with traditional brokerage peers in the industry -- and, interestingly, are the same as aircraft manufacturer Boeing. These are not the 70%+ gross margins of a technology company.
Compass is losing less money per transaction as it scales, but it's still losing a lot of money. The path to profitability, which I'll cover in my webinar, is uncertain. The fundamentals of the Compass business model, anchored by its low, brokerage-style gross margins, coupled with sky-high expenses, paint a particularly interesting challenge for the business -- and the industry -- going forward.
Real Estate Lessons From New Zealand's Latest Lockdown
/The reemergence of Covid-19 in New Zealand, along with new lockdowns, provides further examples of its effect on the property market. As a case study for markets around the world, the results highlight less severe outcomes the second time around.
Another Drop in New Listings
New Zealand's recent lockdowns, which began on August 12th, affected the country in a similar, but less dramatic, fashion than the strict lockdowns earlier in the year. The level 4 April lockdowns were a total shutdown, which saw new listing volumes drop 85 percent. The most recent level 2 & 3 lockdowns are less severe, with a much smaller drop in new listings.

Both lockdowns saw a return to the same behaviour: a drop in new listing volumes. But the effects are wildly different, and tightly correlated to the severity of lockdown.
The monthly change in new listing volumes was most pronounced in Auckland, which was under a strict level 3 lockdown. At level 2, the rest of the country was fundamentally unaffected.

The national drop in new listing volumes was driven by the country's largest market, Auckland. However, looking at only Auckland reveals a less severe impact than one might expect. The drop in new listings is noticeable, but marginal, and new listings are still higher than the same time last year.

With buyer demand remaining strong, the natural result is a drop in inventory. But similar to new listings, it is not as severe as one might expect: A small decline, rather than plummeting inventory levels.

Inventory is certainly constrained, but it's not quite the property armageddon that is sometimes portrayed in the media.
Strategic Takeaways for International Markets
New Zealand's Covid rollercoaster highlights several lessons that can be applied to markets around the world:
Subsequent lockdowns appear to have less of an effect on consumer confidence in bringing a home to market. There is less overall impact on new listing volumes.
The more severe the lockdown, the larger the drop in new listing volumes. However, the severity is not linear; the strictest lockdowns have an exponentially greater impact on the market (Auckland's level 4 lockdown saw a monthly decline in new listings of 46 percent, compared to a monthly decline of 7 percent during the August level 3 lockdown).
If authorities can implement lockdowns in a targeted, focused way, the effect on the real estate market is significantly lessened.
As the pandemic continues around the world, the evidence from New Zealand suggests that the worst for the property market may be over (at least in terms of new listings and inventory). Subsequent lockdowns appear to have less of an effect, with a targeted approach yielding the best results.

About the author: Mike DelPrete (email me)
Mike is a global real estate tech strategist, and a scholar-in-residence at the University of Colorado Boulder. He is internationally recognized as an expert and thought-leader in real estate tech. His evidence-based analysis is widely read by global leaders, and he is a sought-after strategy and new ventures consultant. His research and insights have featured in the New York Times, Wall Street Journal, Financial Times, and The Economist.
Latest analysis
All Articles


