Zillow, Opendoor, and controlling the consumer journey

Last week I conducted the iBuyer Intelligence Briefing -- a conference call on the latest iBuyer news, trends, and insights -- with listeners from around the world.

After the call, one particular question lingered: Which part of the industry controls the starting point of the real estate transaction, portals or iBuyers? Who has the advantage, and what are the implications for iBuyers?

Zillow's lead generation machine

Zillow announced its Zillow Offers program in Phoenix earlier this year, and started buying houses in May. It is heavily promoting the program across its site. While looking in the Phoenix market, a prominent message is displayed on all active for sale listings.


And if a visitor looks at an off-market listing (like their own home), this is the call-out at the top of the listing.

 
Screen Shot 2018-10-06 at 5.04.43 PM.png
 

In its latest quarterly results, Zillow revealed how effective the promotion was: "Since launch, we have received more than 10,000 offer requests from potential sellers." And: "...in Phoenix, for example, we are seeing about 15% of all dollar value that's being sold in Phoenix any given month." That translates to about 1,600 offer requests per month.

Opendoor is on record saying that more than "one in two sellers who received an Opendoor offer" will accept it. It's currently buying around 300 houses per month in Phoenix, so that's about 600 offers made per month.

 
Screen Shot 2018-10-06 at 9.18.04 PM.png
 

There's a difference between an offer being requested, and an offer being made. What's clear, though, is that Zillow is generating a massive amount of offer requests each month, at volumes that rival (and exceed) Opendoor.

Most importantly, Zillow's leads are coming with zero incremental customer acquisition cost, while Opendoor and other iBuyers must advertise directly to consumers to generate leads.

The Zillow effect

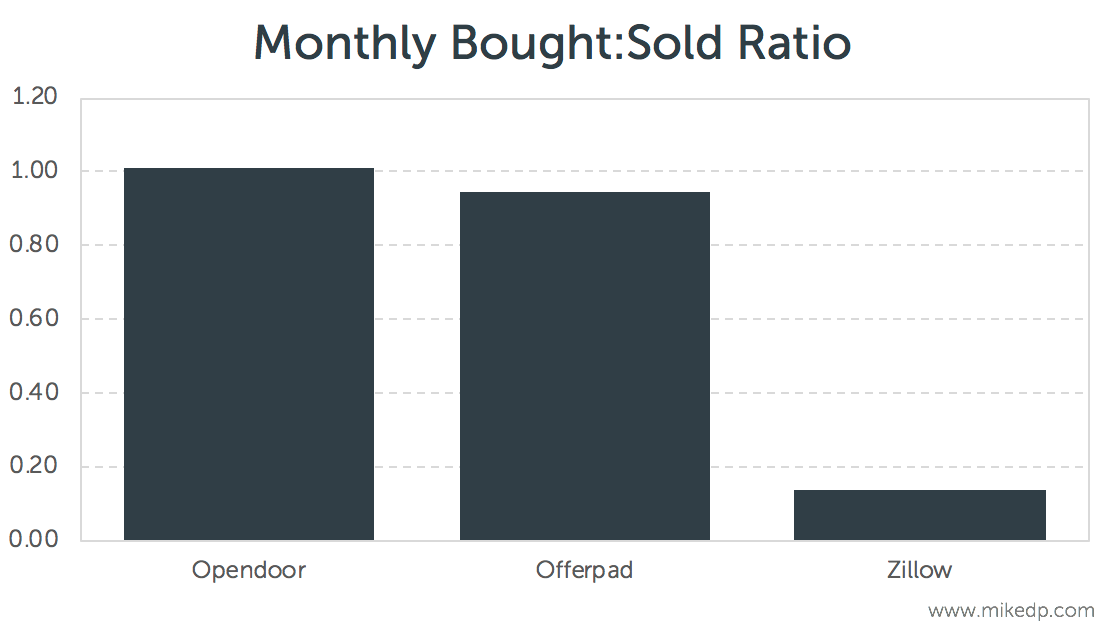
The ultimate question is whether Zillow's entry into the market is having an effect on Opendoor. Is Zillow soaking up demand from consumers, to the detriment of Opendoor?

 
Screen Shot 2018-10-06 at 8.16.31 PM.png
 

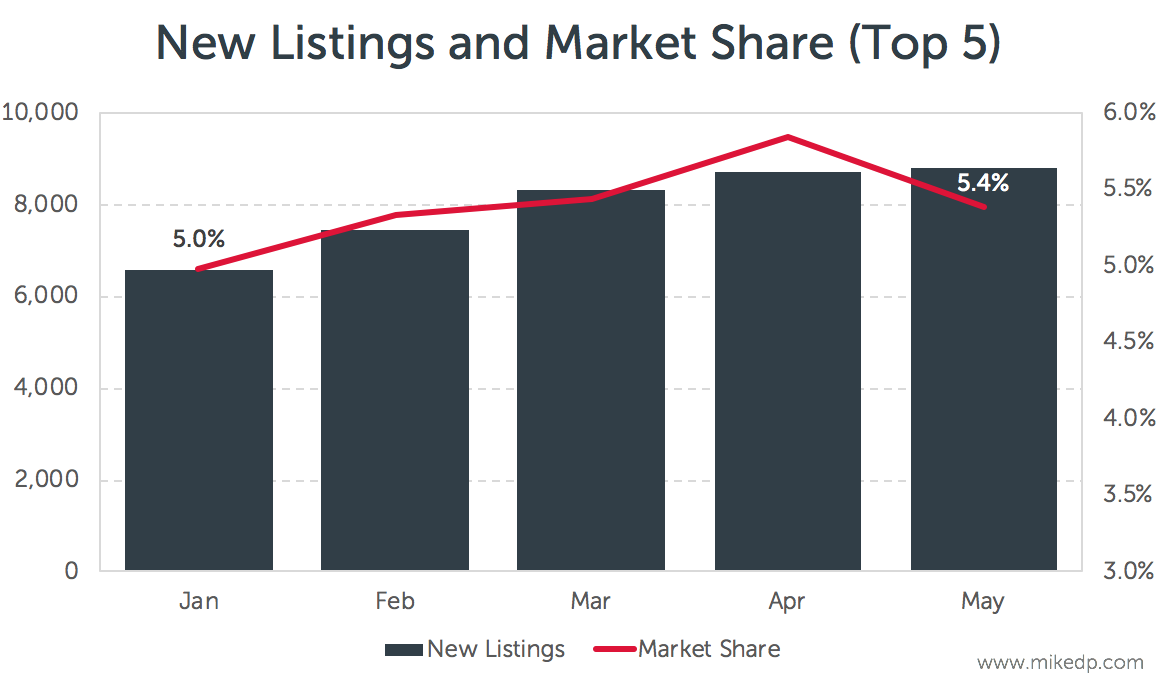
The chart above shows a clear picture: the number of homes that Opendoor is purchasing in Phoenix has plateaued. But there are two possible explanations for what's going on:

  • Zillow is having an effect on Opendoor's traction in Phoenix by soaking up consumer demand.

  • Opendoor is slowing its buying activity for other reasons (we've seen this before).

It's too early to say if Zillow is having a direct effect on Opendoor's business in Phoenix. Opendoor may slow its buying activity for a variety of other reasons, namely a potential market slowdown.

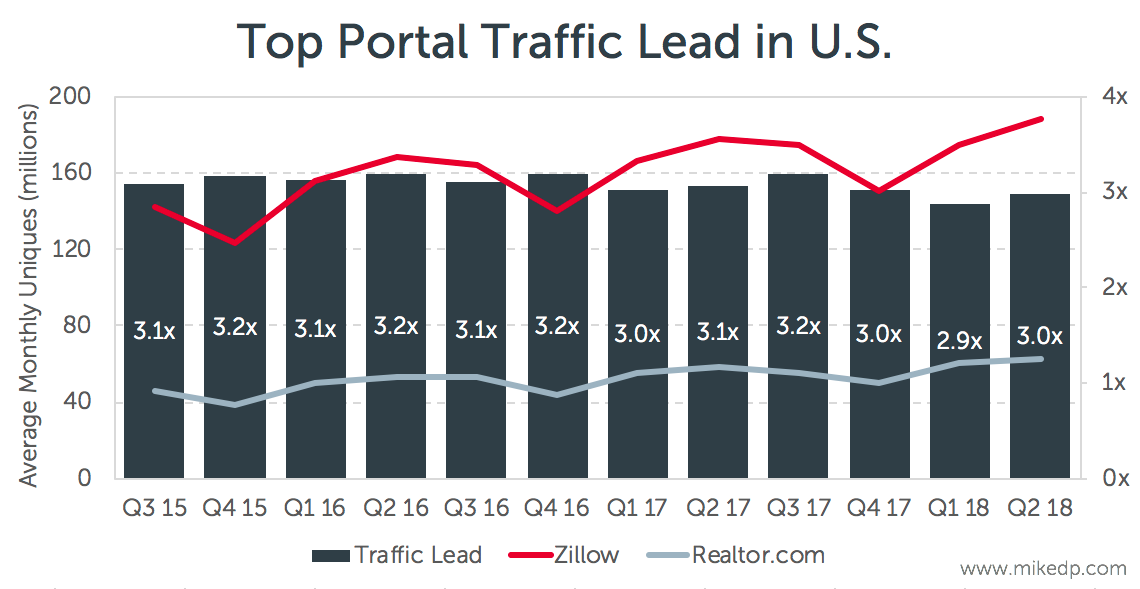
But what's clear is the leading position Zillow holds in the consumer journey and its massive reach give it a competitive advantage in acquiring customers -- which has long-term consequences.

Strategic implications

Back in February, I wrote the following: "The most logical response from a major player such as Realogy or Keller Williams would be to launch their own iBuyer program." Which is exactly what happened last week. More competition is coming to the market.

As incumbents, portals, and other new entrants enter the iBuyer market, they have the potential to soak up consumer demand and adversely effect Opendoor's business.

But for Zillow in particular, the evidence is clear: Real estate portals are in pole position to capture consumer demand for iBuying services, because they are at the start of the consumer journey. Will other global portals follow Zillow's lead?

Zillow will beat its Q3 homes revenue guidance

With September wrapping up, we can look at the latest iBuyer numbers out of Phoenix and see how Zillow is doing.

Why it matters: Based on the data in Phoenix alone, Zillow will beat its Homes revenue guidance of $2 - $7 million. But other indicators, including a lower-than-expected margin and higher purchase prices, are worth watching.

Q3 Revenue beat

During its last earnings results, Zillow provided Q3 revenue guidance for its Homes unit of $2 - $7 million. Based on our proprietary data set for Phoenix, Zillow sold 30 properties in Q3 for $9.3 million in revenue. So in Phoenix alone, Zillow will beat its revenue guidance.

Thirty sales over three months is a modest amount. By comparison, Opendoor sold 26x that number in the same period. Zillow is clearly still in its ramp-up period and has some ways to go.

This result highlights a few other observations:

  • Guidance is hard. Zillow is still finding its way in this new endeavor, and is having to constantly readjust its assumptions. It’s a positive sign, but clearly highlights how new to this business Zillow is.

  • Zillow's full-year revenue guidance of $20 - $40 million in Homes revenue is achievable (it simply needs to sell the same number of houses in Q4 to hit the low end of that range), but a lot depends on traction in other markets. I would expect Zillow to revise this guidance during the next earnings call.

Buying momentum up

In Phoenix, Zillow continues to expand its operations on a month-to-month basis. The number of homes purchased is increasing by about 40% month-on-month — to over 60 in September. By comparison, Opendoor is buying around 5x as many houses in that same period (solely in Phoenix). Zillow is clearly serious and committed to this new initiative.

Unsold inventory

One of the potentially worrying indicators, however, is the amount of unsold inventory Zillow has in Phoenix. While the number of properties it is buying is increasing, the number sold is low.

To-date, Zillow has purchased over 150 properties and has sold 30.

In September, the ratio of homes bought to homes sold is 0.14 — down from 0.34 in August. Comparatively, that ratio for Opendoor is 1.01 and 0.95 for Offerpad.


Clearly Zillow is still ramping up its operations so it’s natural to expect a lag between buying and selling properties. But even accounting for a 90 day holding time window, the September number should have been larger (I would have expected a buy:sell ratio closer to 0.50). All eyes are on October.

There are a number of other interesting indicators worth watching:

  • A lower-than-expected margin (the difference between what Zillow buys and sells a house for).

  • A median purchase price that is materially higher than its iBuyer peers (but is starting to drop).

Is Compass really a tech company?

Earlier this month, The Real Deal published an excellent article about Compass. And the article included one of my favorite things: numbers.

Why it matters: Opinions aside, the latest numbers allow us to compare Compass to its peers, and really answer dual questions: Is Compass doing anything novel in the industry, and is it really a technology company?

Comparing growth rates

I'll be comparing Compass to two of its peers: Redfin and Purplebricks. Both businesses, which I know well, represent the most successful new models in real estate that are changing the way people buy and sell houses. They are successful in terms of overall revenue and transaction volumes, demonstrating market traction at scale.

Overall revenue growth for all three firms is growing impressively. It's undeniable that Compass' revenue growth is accelerating.


The core of the Compass business model is making acquisitions. Armed with $800 million in venture capital, it is aggressively buying up agents and brokerages.

Transaction volumes are all increasing. Again, Compass' projected growth in 2018 is impressive, but that's what happens when you buy market share. By comparison, Redfin and Purplebricks are growing organically.


Is the Compass model novel?

The Compass investment thesis centers around technology. It claims that it is a tech company (with tech company valuations), and is building the "first modern real estate platform" that provides "real estate agents tools that increase efficiency."

The data has yet to prove out this thesis. Starting with another tech company, Redfin, the numbers show that it is clearly a more efficient business than Compass -- because its operating model is different.

For Compass 2018, I've included two numbers: 7,480 is the total current number of employees, while 4,800 is the midpoint between 2017 and 2018. Given that Compass is growing so quickly, it makes sense to look at both to calibrate the comparison.

The data above is total number of employees. If we look at overall agent efficiency, as I did earlier this year when comparing Compass, Redfin, and Purplebricks in the U.K., the contrast is more pronounced.

The evidence shows that, at best, Compass agents may be incrementally more efficient than the industry average, but Redfin and Purplebricks agents are exponentially more efficient.

Compass' growth strategy is novel: raise a massive amount of capital and use it to acquire market share. But the operational model of the business is fundamentally the same as every other traditional brokerage -- as the data around efficiency shows. It's not really changing the industry in the same way that Redfin, Purplebricks, or Opendoor are -- it's just moving market share around.

Is Compass a technology company?

Analysis I conducted in early 2018, as part of my Emerging Models in Real Estate Report, showed that -- roughly speaking -- about 10 percent of the staff of global leaders was technical. Compass was the outlier at 4 percent.

96d595ef-5ec9-4407-be46-4a2a6a843566.png

Using the latest data (7,480 total employees and a 200-person tech team), that percentage has dropped to 2.7 percent.

Even if you calibrate for Compass' fast agent employee growth through acquisition, the overall percentage is still considerably lower than its peers.

Strategic considerations

There are a few final points to consider when looking at Compass:

  • Being a tech company is not a binary thing, but what is clear is that Compass is less of a tech company than its peers.

  • As opposed to Purplebricks and Redfin, Compass' customer is the agent. The technology it is building is for agents, not consumers.

  • True, exponential efficiency gains come with technology combined with a novel operating model. Technology alone won't deliver it.


Opcity, lead conversion, and the journey down the funnel

Last week, News Corp, owner of realtor.com in the U.S. and the majority owner of REA Group in Australia, announced the $210 million acquisition of lead qualification service Opcity.

Why it matters: With this acquisition, realtor.com dives deeper into the lead conversion funnel in a major way. Opcity features a referral fee business model where customers are worth 36x more than a lead -- which highlights why the U.S. portals are diving deeper into the funnel.

Lead generation vs. lead qualification

Zillow and realtor.com are both lead generators. They drive traffic to their web sites, advertise real estate agents, and generate leads in the form of consumers who are looking to buy a house. This is the lion’s share of their revenues and the core of their business models.

The conversion of leads to actual, paying customers is left up to individual real estate agents, and nominally occurs offline. But this is changing.

In Zillow’s last earnings update, it shared its goal of "moving beyond lead generation and actively evolving toward being a deeper funnel real estate industry partner.” It launched a new, super-charged concierge service where Zillow sales reps qualify leads before matching them with a premier agent.

News Corp’s acquisition of Opcity is the same move: deeper down the funnel. Opcity takes raw leads, qualifies them, and then matches them with an agent. It does not charge per lead, like Zillow or realtor.com, but charges a referral fee for any leads that turn into paying customers (typically 30%-35% of a buyer’s agent commission).

2460992a-0671-48ec-9d17-fadcd1e75b84.png

The cost per lead on Zillow ranges from $20 to $220. I estimate the average to be around $55 per lead. For Opcity, assuming a $250,000 home, a buyer’s agent commission of 2.75%, and a 30% referral fee, each customer is worth around $2,000 — or 36x higher than the value of a lead.

Providing a superior experience, to everyone

The rationale for Zillow and realtor.com to move deeper down the funnel is simple: a better experience.

In the case of both Zillow's concierge service and Opcity, consumers are able to speak to a human being faster, and are matched (not just sent) to an agent faster. Agents are matched with pre-qualified consumers, saving them time and energy. Plus the return on investment for the concierge model is far superior to simply buying leads.

At first glance the Opcity and referral fee model may seem like a bad deal. Why would an agent pay 30%-35% of their commission (around $2,000 for an average transaction) for a referral when they can buy leads for a fraction that price? 

It comes down to the math. Buying leads and converting them to customers costs an agent, on average, around $7,500 per customer -- compared to $2,000 for a customer through Opcity.

It all comes down to the conversion rate. Operating at scale and singularly focused on doing one job, Opcity and Zillow have the scale and technology advantage to convert leads more quickly and efficiently. They have call centers, teams, data, and a long list of agents if the first one contacted doesn’t answer the phone. It's no surprise their conversion rate is higher.

A big revenue opportunity

So how big is the opportunity from a revenue standpoint? (The analysis below is based on Zillow, simply because there is so much more data available, but the same logic applies to realtor.com and Opcity.)

Back in FY16, when Zillow last reported the figure, it generated around 17 million leads during the year. If we assume Opcity’s 4% lead conversation rate (between 3x-5x the industry norm of 1%) and a 30% referral fee, those 17 million leads are worth $1.4 billion in revenue to Zillow (about 50% higher than the ~ $930 million in current premier agent revenues today).

Both Zillow and realtor.com can better monetize their leads if they qualify them and adopt a referral fee structure. Realtor.com now has that option through Opcity.

Given the industry upheaval it would create, it's unlikely that Zillow would change its fee structure. Rather, it will likely approach the same commission rate through the existing premier agent program and share-of-voice bidding system (similar to Google AdWords). Zillow will get there in the end, but through a different path: by providing more value to agents and growing the revenue per lead.

Implications for real estate portals

The core of this entire model is the buyer lead, which only works in markets where there are buyer’s agents. In international markets like the U.K., Australia, and New Zealand — where there are only listing agents — buyer leads are not nearly as valuable.

A similar lead qualification service still has merit for seller leads, when consumers are looking for a listing agent (see HomelightOpenAgent, or REA Group’s Agent Finder service). But real estate portals generate significantly fewer seller leads with a lower intent.

To sum it up for portals: Pay close attention to lead qualification if you operate in a market where you can monetize buyer leads. It's a superior experience with a big revenue opportunity.

Strategic implications

For anyone involved in this sector, there are a number of key takeaways:

  • A concierge, lead qualification model provides a superior experience for consumers and agents. And for agents, it delivers a superior return on investment.
  • Real estate portals like Zillow and realtor.com can monetize qualified leads much better than raw leads. More value to agents = more revenue.
  • The recurring theme here, which I discuss often, is the importance of people in the process. Augmenting -- not replacing -- humans with technology is the winning formula.
  • Lead conversion is important! Small teams can't compete, but the larger platform plays (Keller Williams, Compass, etc) can absolutely build products (technology + people) that improve lead conversion at scale. But are they?

If you work for a real estate portal or lead generator and want to capitalize on the lead conversion opportunity, I can help. I currently advise a select number of real estate portals on an exclusive basis (to avoid competitive issues). Drop me a line if you’re interested in exploring the opportunity for your market.

Analyzing the top portals' financial results

Over the past month, a number of the biggest real estate portals around the world have released financial results: Zillow Group, REA Group, Domain, News Corp, Scout24 Group, and Trade Me.

Why it matters: While the results themselves are fairly dry and self-congratulatory, it does give a glimpse into business performance. When viewed as a whole, the results show a number of interesting trends, and give me a chance to highlight the insights behind the numbers, and the numbers behind the story.

Revenue growth comparison

Overall revenue growth sets the foundation for this analysis, and it's quite varied around the world.

The Australian portals are seeing exceptional growth due to the magic of vendor-funded marketing. In the U.S., both Zillow and Realtor.com are starting to slow down, with Zillow investing in adjacent revenue streams. And in Germany, ImmobilienScout24 sees a positive result after a period of relative flatness.

What blows me away, however, is the massive result in Australia. REA Group and Domain recorded huge revenue gains, and nearly all of it from depth products.

The growth strategy isn't rocket science. REA Group generated $100 million in additional revenue by selling bigger photos.

It's worth noting what is driving the revenue growth in each market: more customers, or a higher average revenue per advertiser (ARPA). In the case of REA, Domain, and Trade Me Property, it is all ARPA, which are customers (agents and home sellers) paying more for each listing. However, IS24's revenue growth is entirely driven by an increase in customers and flat ARPA.

In other words, the portals in Australia and New Zealand are fully penetrated but can still raise prices. In Germany, IS24 is struggling to increase revenue per customer, but still managed to sign up more customers over the past six months.

In my latest report, The Future of Real Estate Portals, I introduced the following portal value curve. In essence, it states that product development is becoming more expensive, delivering less value to customers.

The key takeaway is where the revenue growth is coming from: low effort, high value products that promote agents and properties (essentially larger photos displayed more prominently). That's where the big gains are coming from.

The higher-effort products (predictive analytics, lead qualification, etc) aren't a significant contributor to revenue.

Catching the leaders

On a recent call with an investment analyst, we discussed the opportunity for a runner-up portal to overtake the leader. Can Domain take market share from REA in Australia? Can Realtor.com catch up to Zillow in the U.S.?

The evidence suggests that the answer is a resounding no.

The data from the past two years shows an uncannily steady state between the leading and runner-up portals in both markets.

In the core residential listings business, Domain has remained at 27% the size of leader REA. Both business are growing at the same rate; nothing is changing.

In the U.S., the runner-up portal, Realtor.com, has actually lost a small amount of ground when it comes to growth. Zillow is growing revenues faster.

In the important realm of traffic and consumer eyeballs, Zillow and Realtor.com have remained constant for the past three years. Even with all of the hoopla against Zillow for raising prices in NYC, agent revolts, and increased pressure by Realtor.com, it hasn't meant a thing in terms of overall traffic and revenue numbers.

There's a big difference between a catchy headline and the facts of a situation. Always look for the facts.

Mixed results in adjacent revenue streams

The final area of interest is around portals' expansion into adjacent revenue streams. If you follow my work, you know this topic is of particular interest to me. You may read more of my thoughts, specifically around Zillow, in my analysis of Zillow's Strategic Shift.

The question is no longer whether real estate portals are expanding into adjacent revenue streams, but how they are doing it. There are a variety of strategies at play, with vastly different results.

In Australia, both REA Group and Domain are expanding in different ways. REA bought a mortgage broker in 2017, Smartline, while Domain has launched a trio of new services (mortgage, insurance, and utility switching) via joint ventures. The financial results couldn't be more different.

Both business units are generating decent revenues (more so in the case of Domain, because the overall revenue base is smaller), but only one is profitable. REA's acquisition of an existing business running at scale is returning immediate profits, while Domain remains in the start-up zone of continual (and significant) investments: $27.1 million in FY18.

A deeper look at REA and Domains' mortgage products highlights one final observation. Both are quite similar: well-integrated on the listing pages, a robust loan calculator, and then...

Spot the difference? REA's (top) call to action is a phone number, while Domain's (bottom) call to action is the start of a long online form (without even the first field pre-populated like it was on the calculator -- shame!).

This highlights the importance of consumer psychology in transactions of this magnitude, a topic I recently wrote about in How Psychology is Holding Back Real Estate Tech. REA recognizes the importance of actual human beings in this process, and puts them front and center.

If you have an interest in Zillow's recent acquisition of a mortgage brokerage, look no further than REA Group's Australian acquisition to see how it might play out. Purchased over a year ago, the business is profitable, generating good revenue at good profit margins.

Strategic implications

These latest financial results highlight a few key takeaways:

  • Revenue growth is still primarily driven by core premium products that increase exposure for agents and property listings.
  • The runner-up portals are staying in the runner-up position. There is no data to suggest they are catching the leaders in their markets (this shouldn't be a surprise).
  • Launching into adjacent revenue streams is not a sure thing. Initial investment is very high with no guarantee of success. There are a number of different paths to take, and the initial evidence suggests acquiring existing businesses is the most effective strategy.

How Psychology is Holding Back Real Estate Tech

I was recently on the opening panel at Inman Connect, where the topic was the future of real estate. The conversation centered around the role of technology in the real estate transaction, and the future role of agents (watch the full video).

When I think about the modernization of the industry and technological adoption, my position is that what’s holding us back is psychology, not technology.

It's the psychology, stupid

The big U.S. real estate incumbents can’t stop talking about technology. Each week brings a new announcement about plans for new tech platforms, investments, and initiatives. And while industry gurus love to talk about the impending perfect storm of technology that will revolutionize the industry, I think they’ve got it wrong, and are repeatedly missing a key point.

That key point is human psychology, and the principle is loss aversion. In cognitive psychology and decision theory, loss aversion refers to people's tendency to prefer avoiding losses to acquiring equivalent gains: it is better to not lose $5 than to find $5. (Read more about loss aversion on Wikipedia).

In other words, consumers will prioritise avoiding costly mistakes over making (or saving) more money. 

It’s relatively easy for technology to disrupt high-frequency, low-value transactions. The risk (or potential loss) is low, both due to the small value of the transaction and the frequency with which it occurs. Think services like Uber, Airbnb, and Netflix.

On the other end of the spectrum, it is more difficult to disrupt low-frequency, high-value transactions with technology, because the potential loss from a mistake is so much greater. People typically go to specialists to help with these transactions: divorce lawyers, investment bankers, and expert consultants.

A real estate transaction, by comparison, is off the charts: it is ultra low-frequency, ultra high-value. The potential loss that occurs from making a mistake is huge.

The psychological desire to engage a specialist in these high-value transactions is loss aversion at work. People are willing to pay top dollar to secure a form of insurance on the transaction; someone to hold their hand through the process. Even when cheaper, tech-focused alternatives are available.

It's not technology holding the industry back, it’s psychology. And no software platform, artificial intelligence chatbot, or mobile app is going to change that.

The role of technology

When it comes to real estate, technology has a dual role: making agents more efficient, and providing a better customer experience. It’s not about replacing agents or removing the insurance of having a specialist involved.

This is where the incumbents — with their regular announcements of big technology plays — are at a disadvantage, and the newcomers have the advantage.

It's the businesses that are built from the ground up around efficiency that have the advantage. More efficient agents means less agents. For a big incumbent to make this change would require an entire retooling of the business, and firing a massive amount of staff and agents. It's too disruptive, and classic innovator's dilemma.

The best way to illustrate this point is agent efficiency: how many deals a typical agent closes each year.

Compass, for all its talk about using technology to make agents more efficient, has yet to demonstrate a significant impact. On the other hand, businesses built from the ground up that utilize technology to improve agent productivity are seeing dramatic gains in efficiency: a 7x improvement at Redfin and a 10x improvement at Purplebricks in the U.K. That's exponential improvement vs. incremental improvement, and is the real eye-opener in the industry.

Strategic implications

Successful new models in real estate understand the key point: smartly combine people and technology. They understand of the role of technology (efficiency and experience), and the role of psychology.

Investors and entrepreneurs assuming that tech will disrupt the real estate industry in the same way it has with low-value, high-frequency transactions are taking a myopic view. It's psychology holding us back, not technology.

If you're interested, be sure to check out the video from the full panel discussion (around 25 minutes) from Inman Connect 2018.

A Deeper Look at Zillow's Instant Offer Numbers

Zillow's Q2 financial results include some insight into its Instant Offers business and traction to date, but the data is five weeks old. Let's take a look at the most updated data; it's more interesting.

All of the data below is for Phoenix, is based on public records, and is accurate as of August 8, 2018 (yesterday).

A quickly growing business

Zillow announced that it bought 19 homes during the second quarter (through June 30). The current total is 62. That's an additional 43 homes purchased in July and the first week of August. A good ramp up.

Of those 62 homes, 10 have sold, with the remainder either under contract, for sale, or coming soon.

Zillow is purchasing more expensive homes than its iBuyer competitors in Phoenix (Opendoor and Offerpad). The average purchase price for the 62 homes Zillow purchased is $324,000, 25 percent higher than Opendoor.

It's worth noting that the median purchase price is materially higher than the estimates being used by analysts and what was suggested in Zillow's Q1 announcement, $257,000.

For the iBuyer model to work, the home must be sold for more than its purchase price. I call that price appreciation. As a percentage, the price appreciation on the 10 homes Zillow has sold is 3.3 percent.

But because Zillow is purchasing more expensive homes than its competitors, when translated to a dollar value the amount is about equal to Opendoor at $9,600 per home.

Keep in mind that this number is not the net profit per transaction. It does notinclude any of the costs associated with buying and selling a home, including agent fees (which are considerable), buyer concessions, finance, holding, and repair costs.

Moving fast

The 10 homes Zillow sold moved very quickly. The sample size is small so it shouldn't be used as an assumption for the business at scale.

Having said that, of those 10 homes it has taken an average of 20 days to get a contract, and an additional 22 days on average to close. These sales are not indicative of long-term numbers. They are quick sales by definition so they have unusually low times on market.

Strategic implications

A few takeaways to keep an eye on:

  • Zillow is ramping up fast, buying 43 homes in the last five weeks. It's serious.
  • Zillow is buying more expensive homes than its competitors and what the market predicted. It's still early days, so let's see if this changes over time.
  • As a dollar value, price appreciation on the ten homes sold is in line with expectations and local competition.

Real time data

You may have noticed the market reacting strongly to Zillow's Q2 announcement, which contained five-week-old data. If you're a serious investor and don't want to live in the past, drop me a line.

Zillow's Strategic Shift

Zillow announced its Q2 financial results today, along with the acquisition of a mortgage broking business.

Why it matters: This is another big move that signals Zillow's clear intent to get closer to real estate transactions.

A major move into mortgages

In my opinion, the most interesting part of today's announcement is Zillow's acquisition of a mortgage broker, Mortgage Lenders of America LLC.

Why? Two reasons:

  • This is exactly the same move REA Group pulled off in Australia last year when it acquired the mortgage broker Smartline (both businesses even have roughly the same number of employees).
  • In addition to its Instant Offers program, this is another huge example of Zillow moving closer to the transaction in a big way.

Closer to the transaction

In my latest report, The Future of Real Estate Portals, I provide a strategic framework for how to think about portals expanding into new businesses. There are two ways: getting involved in more of the transaction, and getting closer to the transaction.

There are two big examples of real estate portals making big moves to get closer to the transaction: Zillow's Instant Offers program, and REA Group's acquisition of mortgage broker Smartline.

Zillow's announcement today is yet another major -- and not unexpected -- move in that direction. That's a big deal; it's a clear signal of intent and strategy, and one that no other portal is matching around the globe -- yet.

A strategic shift

What we are seeing is the result of a strategic shift at Zillow, likely started in 2017, and now moving full speed ahead. It is an intentional move to get closer to the transaction is all areas of the business, and move away from simply being a marketplace that connects buyers and sellers. 

As I mention in my report, it is a move from search engine to service engine. And it's a move to larger revenue pools. Zillow's existing mortgage lead gen business generates about $4 per lead. Mortgage origination can generate hundreds to thousands of dollars per customer.

It is a big move. While all the iBuyers talk about providing mortgage solutions to streamline the process, no one has purchased an existing mortgage broker. This isn't testing the waters; it's jumping straight in and hoping for the best.

Premier agent growth as catalyst 

I believe one of the big drivers of Zillow's strategic shift was the slowing growth of its flagship premier agent program. As I've written about in the past, it is naturally slowing down.

To Zillow's credit, with slowing growth in its main revenue driver, it did two things:

  • Made the aforementioned strategic shift to get closer to the transaction through Instant Offers and Mortgage lending.
  • Made significant investments into its premier agent program to improve lead quality and value to agents.

The first action opened up new areas of growth. The second arrested the decline and stabilized the premier agent program.

Strategic implications

There are a number of key takeaways from Zillow's latest move:

  • Moves to get closer to the transaction are people-intensive. At scale, Zillow's Instant Offers will have hundreds of employees on the ground. Mortgage Lenders of America has around 300 employees. Unlike a classic marketplace business, these new growth areas are expensive and low margin.
  • This is going to happen everywhere. Expect every major real estate portal to get deeper into the mortgage and finance space.
  • Zillow is not standing still. Its business today looks quite different than it did 12 months ago. Does yours?

Rightmove's Growth Continues to Slow

Rightmove announced its half-year financial results today, with revenue growth continuing to slow (down to 9.7 percent).

Why it matters: This is a continuation of the "Rightmove dilemma" of a narrow strategy with slowing growth, and no other revenue streams. It's neither good nor bad, but a fact that investors (and my readers) should be aware of.

A narrow strategy with slowing growth

Rightmove, the U.K.'s leading real estate portal, is a company that I frequently analyze. It is a global leader in the field with a unique, focused strategy.

In my latest report, The Future of Real Estate Portals, I discuss the Rightmove dilemma extensively. Unlike many other portals, it has not diversified its products or revenue streams beyond the core listing advertising business.

The strategy has served the business well for the past decade, but the strategy is beginning to show limitations. Revenue growth is slowing, and today's announcement shows a continuation of that trend.

The two key numbers

The key narrative is growth, with two key numbers: revenue growth and ARPA (average revenue per advertiser) growth.

Once an additional decimal is added, Rightmove's results show annual revenue growth of 9.7 percent (which it rounded up to 10 percent). This is the lowest number in years, and is the first time it has dipped below 10 percent.

Because Rightmove has not diversified its revenue streams, revenue growth is almost entirely driven by ARPA growth (how much it is able to charge its customers). This number, too, is dropping.

ARPA growth for the half-year is down to 8.3 percent, and is projected to stay at that rate for the full year. Once again, this is the lowest number in years. Rightmove can only raise its prices so much.

Implications for Rightmove

This is not the demise of Rightmove. It is still an incredibly strong business, with nearly-impregnable network effects that will likely protect its core business for years. The dilemma is about growth, and the right strategy to match its ambitions. Its growth prospects are challenged.

Rightmove is bumping up against the glass ceiling of price rises; growth is slowing. Slowing revenue growth is leading to tighter cost control, which could inhibit its ability to invest for the future.

Rightmove has not diversified its revenue streams. Nothing new is taking up the slack in the revenue slowdown. It has been promoting new premium features and new products for over a year, but they are not stopping the decline in growth.

Implications for real estate portals

For other real estate portals, there are a number of takeaways to this story:

  • Despite your market dominance and powerful network effects, there is a limit to how much revenue you can extract from your customers each year. It will slow over time.

  • Additional premium products and services take more effort to build, and are valued less by your customers.

  • Continued revenue growth comes from diversification into adjacent revenue streams.

Analyzing Purplebricks' FY18 Results

Earlier this month, Purplebricks announced its full-year financial results for 2018, with revenues doubling to £93.7 million.

Why it matters: This is the first public glimpse into Purplebricks' U.S. launch, and across the entire group, there are a number of key takeaways:

  • The U.K. business is materially profitable.
  • The U.S. launch is very expensive, and tracking behind Australia in key metrics from the first eight months.
  • Marketing ROI in the U.K. is flat.

Coverage of Purplebricks

The media and the overall industry's response to Purplebricks' really grinds my gears.

The headlines are all negative, and revolve around "mounting losses" at the business. Some alternate -- and just-as-true -- headline suggestions:

  • Revenues double (again) at Purplebricks
  • Purplebricks' international expansion makes gains
  • Purplebricks maintains steady growth and profitability in the U.K.
unnamed.png

But none of these are as sensational -- nor do they play into the existing narrative -- of mounting losses for a doomed business.

Then you have the inevitable "the sky is falling" comment from the investment bank Jefferies, whose singular achievement has been being consistently and definitively wrong on the sector for the past three years (if you invested money on their recommendation you would have lost 88%). It's alarming that they still have enough credibility to be the go-to quotable source for these matters.

The narrative of "mounting losses"

What's most surprising about the "mounting losses" narrative is that it is unsurprising. Purplebricks recently raised £100 million from Axel Springer. The value of £1 sitting in the bank is exactly £1. Wouldn't you expect Purplebricks to spend it instead?

And like all growing businesses (the financial markets still like growth, right?), you need to spend today to make money tomorrow. The majority of growth-stage businesses are in the same boat -- which is exactly why they are raising money and spending it.

When you spend money today in an effort to grow your business, it's called investment. It's "losing money" in the same sense that you are "losing flour" when you bake bread. It's not about "mounting losses" in your flour reserves; it's about what you can make with that flour.

Materially profitable in the U.K.

Now on to the analysis! The first and most important takeaway from the results is that the U.K. business is materially profitable. The model works, it makes money, and -- at scale -- is profitable.

Whether you look at operating profit (£4.2 million), adjusted EBITDA (£8.1 million), or my preferred EBITDA with stock-based compensation added back in (£5.7 million), the business is finally generated profits after years of investment.

 
unnamed-1.png
 

The U.S. launch takes shape

The big question on everyone's mind is how the U.S. launch is tracking. Based on the numbers reported in its full-year results, Purplebricks USA generated $2.6 million in revenue from around 580 listings.

 
unnamed-2.png
 

That comes out to a hefty cost per listing of around $21,000 (compared to around $400 per listing in the U.K.). To put that in context: it's still early days so that number should be high, and, wow, that number is pretty high.

Comparing the first eight months in a new market: Australia vs. the U.S.

What I find most interesting is a direct comparison of Purplebricks' first eight months in Australia and the U.S. It's clear that Purplebricks is going big in the U.S., spending more than double what it spent for its Australian debut.


But the increased spend isn't yielding results (yet). Despite the massive spend, revenues in the U.S. are still small, with a return on investment about 1/4 of that in Australia. Remember: this is a direct comparison of the first eight months in a new market.

You're probably wondering why. It's a complex situation, but for starters Purplebricks may have launched in the wrong U.S. markets, as I've written about previously.

A few other points to note when comparing launch markets:

  • The price points are about the same: $3,200 in the U.S. compared to $3,300 USD in Australia at launch.
  • The first eight months in Australia yielded around 1,050 listings, compared to around 580 in the U.S.

One factor that's really driving costs in the U.S. is the sales and marketing spend, which is expensive in the launch markets of Los Angeles and New York City. Compared with its Australian launch, Purplebricks is spending more than double.

 
unnamed-4.png
 

Marketing ROI flat in the U.K.

One impressive aspect of the Purplebricks operation is its marketing efficiency. I've always been interested in the customer acquisition costs, as it's a critical KPI for the online agency model.

As we can see, the cost per instruction (CPI) has improved slightly from last year, but is relatively flat. (My chart is on the left, with Purplebricks' own chart on the right.)

A more granular view of the overall marketing ROI (revenue / sales and marketing) shows an overall improvement, but with a recent dip.


This is no cause for alarm. Marketing ROI is still positive and a number of factors may be at play here, including the overall housing market in the U.K. But the data does show a change from what we've seen in the past. Keep an eye on this.

Purplebricks expands to Canada in a big way

Last week, Purplebricks announced that it had acquired DuProprio/ComFree, the leading fixed-fee and for-sale-by-owner business in Canada, for £29.3 million.

Why it matters: This is a great deal for Purplebricks and further strengthens its position as the online agency leader with global ambitions.

Disclaimer: I played a small but important part in this deal, and in the past I have done strategy work with DuProprio. All information in this update is in the public domain (and sourced), and the opinions are my own.

Deal background

If you're looking at the leaders that are changing the way consumers buy and sell houses, two of the biggest global names are Purplebricks and DuProprio.

DuProprio/ComFree is one of the most successful real estate companies no one has ever heard of. I've written about the business in past. Why is it a big deal? With a model similar to Purplebricks, it lists over 40,000 properties each year (about the same number as Purplebricks last year), generates over $40 million (Canadian) in revenues, and has over 20 percent market share in Quebec (by comparison, Purplebricks has around 5 percent market share in the U.K.).

This deal represents two global leaders combining forces under one banner, and an excellent market entry into Canada for Purplebricks.

A big boost for Purplebricks

This acquisition is a big deal for Purplebricks. From a revenue standpoint, Canada immediately becomes Purplebricks' second-largest market.


That's a 25% bump in revenue from just one deal. And what a deal it was.

Deal of the year?

Purplebricks acquired DuProprio for a steal. Let me illustrate by looking at the relative enterprise value (EV) of each business compared to their revenues (source).


This is huge. The financial markets are valuing the Purplebricks business at a ratio ten times higher than the implied value of DuProprio.

In other words, when Purplebricks spent £29.3 million to acquire DuProprio, it instantly created nearly £240 million in value to shareholders (£23 million in revenues valued at Purplebricks' revenue multiple).

The big question is why DuProprio was valued so low. It was acquired by the Canadian Yellow Pages in 2015 for $50 million Canadian, and sold in 2018 for $51 million Canadian. This quote provides our only clue:

"As we continue to streamline and focus our operations, we believe the divestiture of [DuProprio/ComFree] is another very positive step for Yellow Pages and our stakeholders. Under the terms of our senior secured notes, the cash proceeds will be included in the next scheduled note redemption payment, on November 30, 2018" said the Company's Chief Executive Officer, David A. Eckert. 

DuProprio's revenues in 2014 were around $40 million Canadian (source), and Purplebricks' guidance is for around $43 million Canadian in revenues for its next financial year. So while the business has not gone backwards under Yellow Pages, growth has been muted.

Build vs. Buy

The question of build vs. buy is always top of mind when a business looks to enter a new market. Does it spend big money to launch an operation from scratch, or simply acquire an existing player?

Including Canada, Purplebricks has now entered three new markets. In the case of Australia and the U.S., it started from scratch, spending big to build market share over a number of months and years.


Based on its full-year financial results, Purplebricks spent £17.8 million to generate £2 million in revenue in the U.S. Those are expensive -- but not surprising -- start-up costs for a big new market.

Over the past 20 months in Australia, Purplebricks has spent £26 million to generate £17 million in revenues. It's taken a long time and a big investment, but that business is finally approaching breakeven.

By comparison, Purplebricks spent £29.3 million for £23 million in revenues in Canada, a materially better ROI, that took no time at all. And keep in mind that's a one-time expense; the revenues keep on coming year after year.

It's not every day an opportunity like this comes up. But given the chance, buying its way into Canada was a smart move for Purplebricks.

Strategic implications

A few key takeaways stand out from this deal:

  • Global by design. International expansion is a unique and key tenet of Purplebricks' strategy. No other company in this space (Opendoor, Redfin, Compass, Emoov, Yopa, and dozens of others) has expanded beyond one market. Purplebricks is now in four.
  • A great deal. This was a good use of capital and has manifested in a new, valuable asset for Purplebricks. Good deals like this exist in the space; you just have to know where to look.
  • Canadian growth potential. With new (and arguably better capitalized) ownership, DuProprio/ComFree is primed for growth, with Purplebricks ready to invest £15 million further into the business.

Traditional agents wade into instant offers

A Keller Williams team in Phoenix recently launched OfferDepot, an instant offer play, to "help with all the confusion with cash offers vs bringing your home to market."

Why it matters: This is the first move from a traditional real estate company into the instant offers space.

Welcome, incumbents. Seriously.

The idea that traditional real estate incumbents would enter into the iBuyer's instant offers party isn't new. Back in February, I wrote:

"...the more successful Opendoor becomes, the more of a threat they become to industry incumbents, which forces them to respond. The most logical response from a major player such as Realogy or Keller Williams would be to launch their own iBuyer program."

This isn't a top-down corporate initiative on the part of Keller Williams. Rather, this is a local team reacting to the rising interest in iBuyers and pushing to stay relevant.

The Keller Williams team isn't buying houses directly. It is collecting inbound leads from potential sellers, gathering information on the home, receiving instant offers on their behalf, and presenting everything back to the home owner (including an option to list the home on the open market) in a comparative analysis.

Why now?

We can speculate as to the reasons this Keller Williams team decoded to jump in to the fray:

  • It doesn't want to miss the boat. Whether it's Opendoor raising another $325 million or Zillow jumping in with both feet, interest in the space has never been stronger. Traditional real estate agents -- and Keller Williams -- are in the business of selling homes. Why would they let this new model pass them by? Doing nothing is not an option.

  • A one-stop-shop. It's relatively easy for traditional agents to bolt on an instant offer service, thereby turning them into a one-stop-shop for home sellers (and negating the need to contact an iBuyer like Opendoor or Offerpad).

  • Seller leads are super valuable. This is another form of lead generation for traditional agents, with each request representing a likely customer.

Implications for iBuyers

In my previous analysis, I summed up the major implications of incumbents entering the instant offer space. The first deals with the user experience:

"Make no mistake, the offer and the experience from the incumbent is going to be bad. They’re simply not set up to provide the same quality of service as Opendoor."

The online experience isn't great. In a design reminiscent of the mid- to late-90's, users must struggle through a form to submit their home's information. It's a far cry from the premium experience Opendoor strives to offer its customers through the entire process.

But it works. It does what it needs to and collects leads. And it is this dilutive effect that is the biggest implication to dedicated iBuyers like Opendoor. As I wrote in that same analysis:

"The proposition from the incumbents will be poor, but it will be enough to soak up a portion of the demand in the market and take momentum away from Opendoor and other iBuyers."

It's simple economics. If we assume the demand remains constant, the addition of supply will dilute the amount of business any one iBuyer receives.

There will also be more customer confusion as incumbents get into the game. When Opendoor was the only option in town, it was simple. But now there are a variety of choices: multiple dedicated iBuyers (Opendoor, Offerpad), a popular web portal (Zillow), a tech-enabled brokerage (Redfin Now), and a traditional real estate agent (OfferDepot). What's the difference? Who do I trust? It's difficult to explain the various propositions to consumers.

At the end of the day, that's good for traditional brokers and agents (as they can soak up additional demand), and bad for dedicated iBuyers (because of the dilutive effect and customer confusion).

Where to from here

This is just the start! Expect a lot more activity in this space by the incumbents. It's only a matter of time before a big incumbent launches a well-funded, well-designed initiative. And it may not stop at just presenting offers on an iBuyer's behalf...

Online agents consolidate in the U.K.

Two of the top runner-up online agencies in the U.K., Emoov and Tepilo, recently merged their businesses in an effort to grow market share and more effectively compete with leader Purplebricks.

Why it matters: This is the first major online agency consolidation, a natural result of unsustainable unit economics at low volumes.

Winner take most; followers fight for relevancy 

As I've highlighted in the past, the online agency sector in the U.K. is a "winner take most" market. Purplebricks, the leader, has 70%+ market share of the online agent segment.

39a135f7-f989-4de9-8324-4f7e1efc8772.png

The online agency business model only works at scale. A key hallmark of the model are low fees combined with centralized and specialized operations that process listings at an exponentially higher rate than traditional agents.

Purplebricks is profitable in the U.K.; the others are not. The unit economics are favorable at scale (thousands of listings per month), but anything less is a money-losing endeavor. Given this, industry consolidation is a natural outcome.

Runner-up spot up for grabs

As in my last analysis, using updated new listing data from Rightmove shows two clear trends:

  • The #2 spot behind Purplebricks is very much up for grabs. The combined Emoov+Tepilo entity is neck-and-neck with Yopa (in terms of new listings per month).
  • Yopa is seeing sustained, strong growth, nearly doubling its business since January.
49625871-cf75-48a3-9315-170106b032e1.png

Purplebricks is still the undisputed leader, with 5.9 times the new listings of Yopa and 7.6 times the new listings of Emoov+Tepilo for the month of May. 

It's also worth noting that Yopa is seeing strong growth since its capital raise last year. One can imagine that the business is spending big to acquire new customers, so it is unlikely to be sustainable or profitable. But it is growth nonetheless.

Total market share of the top 5 online agents is down slightly to 5.4 percent (based on new listings) in May. Post-merger, I would expect increased activity from Emoov+Tepilo that grows overall market share.

Strategic implications

This deal raises several important considerations in the online agency space:

  • Expect more industry consolidation, and for the slower horses to eventually drop out. The math is simple; the model doesn't work at low volumes.
  • Pay now vs. pay later. When considering the relative traction of Purplebricks vs. Yopa, Emoov, and Tepilo, keep in mind that all of the Purplebricks customers are committing to paying upfront; Yopa and the others offer options to defer payment until after a successful sale. In that sense, it's less surprising that Yopa is seeing such strong growth (no risk for new customers).
  • Two brands or one? Emoov has announced that it will retain both the Emoov and Tepilo brand. This may not allow the combined entity to realize the full synergy of consolidation, but we'll have to see.

Purplebricks targets mid-market America (finally)

Purplebricks launches in Phoenix and Las Vegas this week. This is on the back of its previous launches in Southern California and the New York metro area, and is the latest step in its U.S. expansion.

Why it matters: This is Purplebricks' first foray into mid-market America, the true sweet spot of its business model.

Picking the right target market

Purplebricks’ U.S. launch strategy is markedly different in terms of target markets. In the U.K. and Australia, evidence shows that the typical Purplebricks customer is at the mid-end of the market. However, the U.S. launch targeted high-end markets and customers.

In June of last year, Purplebricks CEO Michael Bruce said the average Purplebricks customer in the U.K. sold for around £240k (data on tens-of-thousands of transactions backs this up). The average house price in the UK is around £230k. 

To use Mr. Bruce’s own words, Purplebricks' success is down to "a higher concentration in the heart of the market rather than the top end where it has been extremely tough."

The story is similar in Australia. An analysis I conducted in 2017 shows similar trends in Victoria and Queensland. My analysis shows an average sale price of $415k AUD in H1 2018, below the overall market median home value.

779947e7-da69-49b5-946c-1df8ac2a942d.png

Then we come to the U.S. According to Zillow, as of January 2018 the median home price was $229k.

Los Angeles County, Purplebricks’ launch market in the U.S., has a median home price of $583k. San Diego County, one of the next launch markets, has a median home price of $540k. And Purplebricks’ latest launch market, the New York Metro area, has a median home price of $374k.

An analysis of 150 Purplebricks listings in the U.S. shows a median listing price of $552k. All of these numbers are significantly higher than the national average (in some cases, over twice as much).

Purplebricks decided to launch in U.S. markets where the median home value is more than double the national average. That’s a completely different launch strategy than its successful international markets.

It’s like taking a budget airline that caters to price-conscious families and launching a New York-to-London route for business travelers. It might not be the right fit. And for a business very much reliant on marketing spend to generate leads, it picked two of the most expensive advertising markets.

The Purplebricks proposition challenge

Purplebricks is clearly the low cost option when compared to alternatives in the U.K. But in the U.S., that's not the case.

In the U.K., the cost savings versus using a traditional estate agent are clear: on average, a home seller saves around £2,000 (outside of London and using national median home sale prices). And yes, this fee is paid upfront regardless of an eventual sale or not.

In the U.S., however, Purplebricks’ price-point puts it right in the middle of a crowded pack (and it just raised its fee from $3,200 to $3,600). It’s less expensive than a traditional listing agent. It’s slightly less or slightly more than Redfin depending on a 1 percent or 1.5 percent Redfin fee, and it’s slightly more expensive than other fixed-fee providers like Redefy and Trelora.

And that’s just the listing fee, which is paid regardless of the house selling or not. A homeseller still needs to pay a typical buyer’s agent fee of 2.5–3 percent.

In short, Purplebricks is not the clear low-price leader that it is in the U.K. There are a number of alternatives, Redfin being the biggest. And the competitive field is big, leaving Purplebricks with a relatively undifferentiated product in a crowded field (this is also true in the U.K., but the difference is that Purplebricks is already #1 in that market).

Strategic implications

There are a number of key points to consider in Purplebricks' U.S. expansion:

  • Its U.S. launch markets were not in its "sweet spot." Phoenix and Las Vegas are, which begins the true test in the U.S.
  • Advertising in L.A. and New York is expensive. Expect Purplebricks to get more bang for the buck for its advertising dollar in mid-range markets like Phoenix.
  • Purplebricks is operating in a crowded marketplace of low-cost and fixed-fee alternatives. It is not the least expensive option, and Redfin is a sizable competitor.

Online agent market share grows in the U.K.

As someone who studies new models that change the way we buy and sell houses, I'm naturally interested in the online agents in the U.K. Late last year, two raised significant money: eMoov raised £9 million in August and Yopa raised £27.6 million in September -- and it's having a noticeable effect on the market.

Mo Money Mo Listings

The charts below look at the total number of new listings for the top online agents, as recorded by Rightmove (and confirmed with data from Zoopla).

39a135f7-f989-4de9-8324-4f7e1efc8772.png

A few facts stand out:

  • Purplebricks is very much in a dominant market position.
  • Both Yopa and eMoov have seen strong gains, followed by Tepilo.
  • HouseSimple is going backwards.

If we strip away Purplebricks' numbers for a moment, the "Battle of the Rest" becomes more clear.

Yopa and eMoov raised a lot of new capital and are deploying it in sustained marketing campaigns. While Tepilo hasn't raised money, it has significantly increased its marketing spend. And HouseSimple's new CEO pulled its marketing spend before a product relaunch.

The correlation here is clear: the more money spent on marketing, the more new listings. It's not rocket science, but that's the point with this model.

If we assume the inverse is also true (the less money spent on marketing, the fewer listings), it leads to a sobering conclusion: the various propositions are undifferentiated with little organic, word-of-mouth growth, or network effects. There are no repeat customers, and the models don't "pick up steam" with more people using them (think Uber or Airbnb).

Online agents -- like traditional real estate agencies and brokerages around the world -- are expensive businesses. Investors take note: there's no secret sauce in this model that changes that equation.

Market share winners and losers

While the online agents are clearly competing with each other, the real loser in this fight is the traditional estate agent. 

The chart below shows the top online agents (Purplebricks, Yopa, Tepilo, eMoov, and HouseSimple) gaining impressive new listing volumes (up 32% from January) while also growing their collective market share of the entire market. They're not taking market share from each other; they're taking it from the incumbents.

Overall new listings market share for the online agents is up from 5.7% in January to 7.1% in April. In that same period of time, the leader Purplebricks increased its market share from 4% to 4.5%.

The time period is small -- four months -- so take it with a grain of salt. Plus these figures are based on new listings, not sales. But the story is clear: the online agent market segment is growing.

Strategic implications

There are a few salient points to consider:

  • Purplebricks is dominant. In April, it had 6.7 times the number of new listings of its nearest online competitor, and a massive 3.3 times the number of new listings of its top 4 online competitors combined.
  • Relative to the point above, scale equals efficiency (and profits). The low-cost model only works at a certain scale. Purplebricks' lead means lower expenses on a per customer basis, likely making it the only profitable online agent.
  • Money, money, money. If you want to compete in this space, you need to spend a lot on marketing. The various models are otherwise undifferentiated.
  • The market is shifting. The online players are all gaining market share, and the loser is the traditional estate agent.

The race for second place is on, with several players raising and spending tens-of-millions of pounds in the market. And there is clearly room to grow market share at the expense of traditional agents. But can they make money, or is it an expensive race to the bottom?

Zillow's revenue growth slows

My analysis on Realtor.com earlier this week surfaced a particularly interesting chart on Zillow's revenue growth. The slowing growth piqued my interest, so I dug deeper into the data and strategic implications.

Zillow has been growing fast over the past few years. The company topped $1 billion in annual revenue for the first time in 2017. But the gravy train can't last forever. How big can Zillow really get?

In its FY17 annual report, Zillow had this to say about its future growth prospects: We see significant opportunity to expand our addressable market over the long term. As we dive deeper in the funnel we see more opportunity to increase the number of transactions and commissions to our partners. 

Many people think Zillow is right at the beginning of its journey, and that it is just scratching the surface of the U.S. market opportunity. However, the numbers tell a different, more nuanced story.

Sources of growth

Zillow generates the vast majority of its revenues (71%) from its premier agent program, which is essentially lead gen for buyers agents.

Other revenue streams, such as display advertising, mortgage leads, and rentals, form a small percentage of overall revenue. Zillow is very much a business centered around -- and reliant on -- its premier agent program. So it is natural to focus on premier agent revenue growth to frame the future prospects of the business.

The key question is: How much runway is left for Zillow to monetize and grow its premier agent business? Are we just at the beginning, or is the opportunity maturing?

Premier agent growth slows

Zillow's year-on-year premier agent revenue growth, broken down by quarter, shows a clear trend of slowing growth. Keep in mind this is off a large revenue base ($760 million annually) so is to be expected. But the trend is clear: growth is slowing.

The chart below shows the same metric, but with absolute year-on-year dollar growth, instead of a percentage. After running up to a high in Q2 2017, the growth rate is dropping, and Zillow is forecasting that trend to continue.

We can also look at the numbers from a full-year financial perspective. The chart below shows steady year-on-year growth in the premier agent program, but Zillow's own guidance shows that it is -- for the first time -- forecasting a slowdown in that growth on an annual basis.

Most businesses eventually reach a terminal growth rate, or a rate at which the business grows in perpetuity. At property portals around the world -- in mature markets where the leaders have effectively saturated the market -- this rate ranges from around five to 15 percent.

Zillow's premier agent program hasn't reached maturity yet, but it appears to have hit its peak growth rate. Now the question is, where will it settle?

Strategic implications: Where to from here?

With Zillow's primary revenue stream slowing, it needs to look at new revenue streams to drive future growth.

One area where Zillow is seeing strong growth is in rentals, where it saw a 124 percent increase in revenue. This is undoubtedly driven by the decision to start charging for rental listings on StreetEasy in NYC in July of last year. You can see the corresponding bump in revenue below.

In 2018, expect Zillow to begin aggressively monetizing new revenue streams. My guess would be a continued focus on rentals and back office tools (dotloop), with additional efforts around new construction and mortgages. This is relatively consistent with the strategy of its international peers.

Also expect Zillow to continue to aggressively monetize agents. By its own admission, "as we dive deeper in the funnel," is code for doing more and charging more. Zillow will attempt to increase the value of existing leads while becoming the technology partner of agencies with transaction management tools like dotloop.

Zillow's slowing premier agent revenue growth will put pressure on the business to develop and exploit new revenue streams. Expect that to be the theme of 2018.

Australia's REA Group vs. Domain

Key points

  • Both businesses are growing at the same, strong rate, with all revenue growth coming from depth products.
  • Domain has a much more diversified revenue stream, at the expense of profitability.
  • Domain is generating 1/4 the listing revenue of REA Group, and is not having a competitive impact.
  • Adjacency revenues are small, and in Domain's case, quite expensive.

Australia is home to two leading real estate portals, REA Group and Domain Group. Last month, both businesses released their half-year results.

REA is the clear market leader and one of the biggest and most profitable portals in the world (read more in my Global Real Estate Portal Report). Domain was recently spun-out from Fairfax Media and listed on the Australian stock exchange, and is now able to invest and focus on its core mission.

Growth from depth products

Both REA Group and Domain are growing strong. Their latest financial results show impressive revenue growth in their core residential listing business lines (and for REA, I'm only looking at its Australian business).

c8a0d141-63f6-4f82-96a2-2cfe9928c3a4.png

Proportionally, both businesses are growing at nearly the same rate (around 19%). This is especially impressive for REA, which is already operating on a large revenue base.

For both businesses, nearly all of this impressive revenue growth is coming from depth products. These are the incremental fees paid by vendors and agents to promote a property listing on the site. $50 million is a big number!

Over time, these depth products are accounting for an increasing percentage of overall revenue (the remainder being subscription fees).

REA is generating about 4x the revenues as Domain in the core residential real estate listing business. I've included Rightmove and Zoopla from the U.K. as an additional data point.

75a6e39d-12df-4ab6-b88a-281c197dc0d0.png

This number isn't changing over time. Both businesses are keeping pace with each other, almost down the the decimal point. In other words, Domain as a strong #2 in the market is not having an adverse impact on REA's ability to grow.

Revenue diversification and profitability

REA Group generates the vast majority of its total revenue from listing fees (depth and subscription), around 84%. Domain, on the other hand, generates only 47% of total revenues from listing fees.

This trend is identical to the U.K. market, where Rightmove, the #1 portal, generates 76% of its revenue from listing fees, compared to 25% for Zoopla, the #2 portal. The #2 players have diversified their revenues in an effort to grow through other avenues.

The market leaders have high profit margins (EBITDA) from the profitable listing business, while the #2 players have lower profit margins from their diversified revenue streams (which tend to be lower margin).

REA's profit margin continues to improve, while Domain's is going down as the business invests in new growth areas. The market leaders are able to continue monetizing their audience without needing to diversify. 

Adjacent services

In Australia, both REA Group and Domain have launched adjacent businesses in financial and transaction services. For REA, this represents a small, but profitable, percentage of total revenue.

Domain, on the other hand, is investing heavily in its transaction services business (which includes utility switching, loan, and insurance products -- and the last two are just getting off the ground). It's generating revenue, but is not yet profitable. In other words, it's spending $12.8 million to generate $11.1 million in revenue -- expensive!

While many in the industry talk up the opportunity in adjacency revenues, the evidence suggests a much smaller (and less profitable) opportunity -- and one that is quite expensive to get off the ground.

Strategic implications for Domain

Domain is clearly operating from Zoopla's playbook: to grow, it must diversify. However, their strategies differ. In the U.K., Zoopla fully owns all of its adjacent businessess. However, Domain prefers joint ventures, owning 50% of its comparison business, 60% of its loan business, and 70% of its insurance business.

Domain is effectively starting its loan and insurance businesses from scratch, while Zoopla acquired existing businesses. Starting from scratch is expensive and will take years of investment.

The scope of the adjacency plays also varies. Zoopla generates and monetizes leads through a comparison portal, while Domain is playing a greater role in the transaction. This is a more expensive, more uncertain, but potentially more lucrative opportunity. The key word is potentially.

Domain's foray in adjacencies should not be viewed as a sure thing. While the intent mirrors Zoopla's strategy in the U.K., the execution is materially different, with the result being far from certain.

Is Realtor.com in it to win it?

On March 7th, this report on Realtor.com owner News Corp piqued my interest. Chief Executive Robert Thomson, referring to Realtor.com, said, "Obviously we’re in a competition, long term, to be number one..."

He went on to say, “...I think it’s fair to say that we turned what was the number three company into a very strong number 2 and, depending on the quarter, depending on the metric, in some quarters the fastest growing."

Here's the thing: I don't think Realtor.com is really competing to be number one.

Growth metrics

If we look at the most important metrics, I don't see evidence that Reator.com is the "fastest growing" in any category. These self-reported traffic metrics are essentially static: Zillow has around 3x the traffic of Realtor.com.

Zillow is growing its revenue (from a larger base) considerably faster than Realtor.com.

On a quarterly basis, Zillow blows away Realtor.com in terms of year-on-year revenue growth (again, from a much higher base).

The last chart does show an interesting trend, which is slowing revenue growth at Zillow compared to rising growth at Realtor.com. But in absolute terms, during the last quarter Zillow increased its revenue by $54 million while Realtor.com increased by $17 million -- a big difference!

There's still a lot of distance between the two, but it's true that Realtor.com is trending upwards while Zillow's revenue growth is slowing.

I'm not sure I'd agree that Realtor.com is the "fastest growing" in any meaningful metric, but the last three quarters show the start of a promising trend for the business.

Is Zillow concerned?

If Zillow were genuinely concerned with Realtor.com's growing momentum, I'd expect its sales and marketing expense to increase. If Realtor.com's market share were growing, Zillow would be spending more advertising money in response.

Aside from a slight bump a few quarters ago, Zillow's sales and marketing expense as a percentage of revenue is relatively flat and trending downwards.

Serious competition for top spot?

You can't argue with the fact that Realtor.com would like to be the #1 portal in the U.S. market. But are they really in a serious competition to be #1?

News Corp has been a major investor in REA Group, the leading portal in Australia, for almost two decades. More than most, it understands the power of network effects and how expensive and futile it can be to unseat a #1 player.

So is News Corp realistically expecting to overtake Zillow in the U.S.? I doubt it. I believe it's happy to run slipstream to Zillow and operate a strong, profitable business in its own right, but remain the #2 player. Attempting to overtake Zillow would be incredibly expensive and uncertain, and the resulting marketing war would drain all profits from both companies.

News Corp would never admit this strategy (who would admit they're happy to be the runner-up?). Being the underdog and striving to overtake the market leader is a great story and good for morale, but it will probably remain just that: a story.