The Opendoor Paradox: A Strategic Analysis
/
Last week I had the pleasure to visit Opendoor, the billion-dollar real estate disruptor, to give a presentation on emerging models in real estate around the globe. The presentation covered my two-year research into the winning models that are changing how houses are bought and sold.
There were some great questions from the audience, both on international models but also my thoughts on the Opendoor model itself. These thoughts, in addition to a number of recent conversations with investors interested in the space, led me to contemplate Opendoor’s future strategy and the complex competitive situation it faces.
The end result is what I call the Opendoor Paradox, and the premise is simple: the more successful the business becomes, the harder it will be to succeed.
Business model challenges
The business model of Opendoor and other iBuyers (those that buy houses directly from consumers and then sell them on) has a number of challenges:
An undifferentiated product. At its core, all iBuyers offer the same basic product to consumers: certainty and simplicity. There may be price competition or various technologies to support the process, but those advantages lie in the margins. The typical consumer only cares about one thing: instantly selling their house.
Resource intensive. The iBuyer model is expensive, and not just because it’s buying houses. To be successful, iBuyers need a lot of boots on the ground in each market they operate. These businesses are people intensive.
No repeat customers. This is true for all of real estate, but it doesn’t change the fact that without repeat business the cost of attracting new customers is expensive. There are no economies of scale around attracting and retaining a loyal clientele. Most importantly, this levels the playing field and reduces the barriers to entry for competitors.
Competitive tension
The U.S. is big, but for whatever reason the growing pack of iBuyers have all decided to launch in the same bunch of cities. Phoenix, Las Vegas, Atlanta, Orlando -- that’s the battleground. It’s a mess of a competitive situation where they will end up spending valuable time and resources competing against each other instead of growing the market.
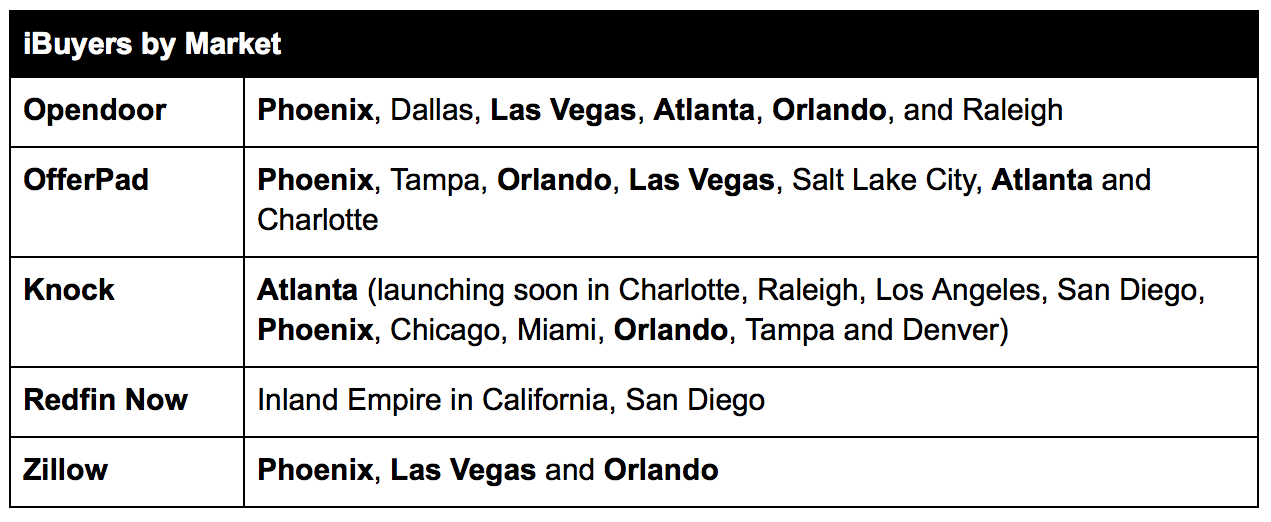
Markets in bold have three or more active iBuyers.
Traditional marketplace businesses have a first-mover advantage. The first to enter a market builds brand and audience, and with each day that advantage becomes harder to overcome (network effects).
But that’s not true with iBuyers. Being first to launch in a market doesn’t necessary bestow an unfair advantage.
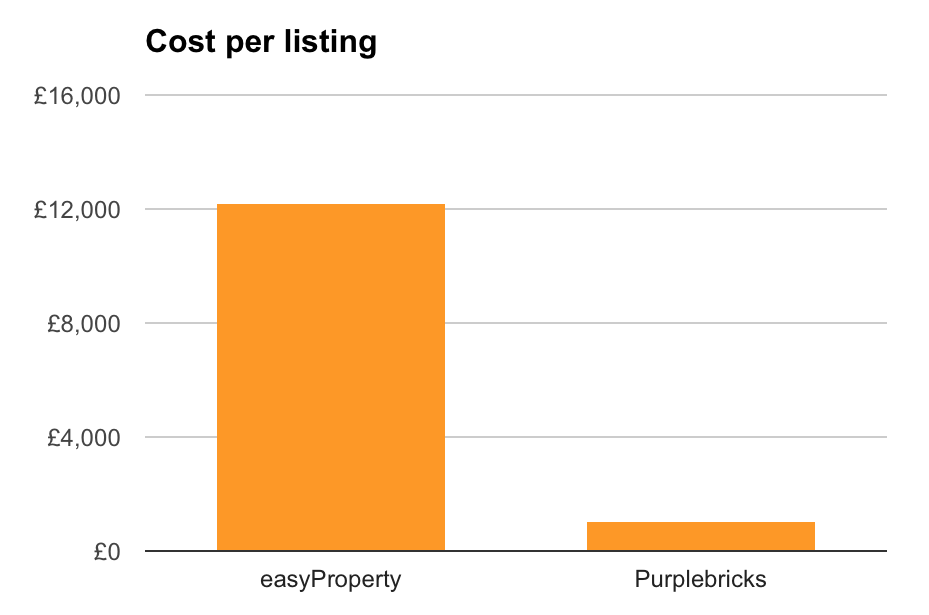
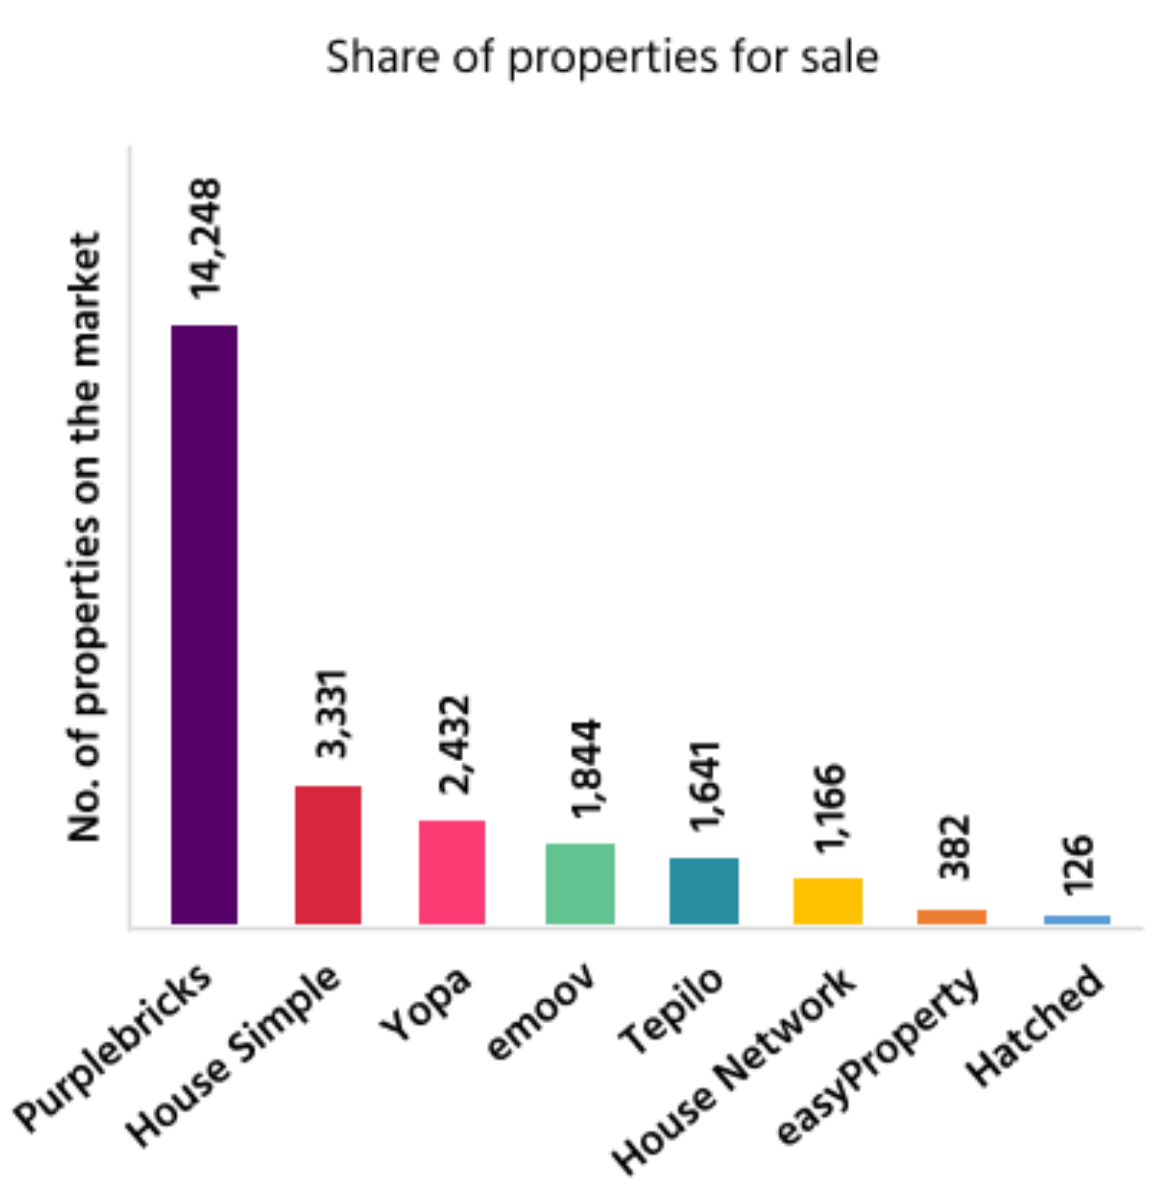
Because of this, it’s most likely a winner-take-most market, similar to Purplebricks and the online agencies in the U.K. With a distinct lack of network effects, an undifferentiated consumer proposition, and no customer base, you end up with a healthy competitive field that, over time, is most likely dominated by one large player.
I would expect to see more competitors launch in 2018. The market is going to get very crowded very fast. And that forms part of the paradox: the more successful Opendoor and its model becomes, the more competitors will enter the space to get a piece of the action.
The real competitive threat: incumbents
While the various iBuyers might beat each other up through tough competition in each market, that’s not the biggest competitive threat they face. The top competitive threat is the massive real estate incumbents themselves.
This forms the next part of the paradox: the more successful Opendoor becomes, the more of a threat they become to industry incumbents, which forces them to respond. The most logical response from a major player such as Realogy or Keller Williams would be to launch their own iBuyer program.
This is what Redfin has done with Redfin Now. Redfin was able to spin this test up quickly and is now able to adopt a “me too” proposition when attracting new customers. For a small amount of effort, incumbents can blunt the iBuyer proposition.
It’s a simple extension: If a consumer decides to sell their home with an incumbent, they can choose the traditional agent services for a commission, or they can sell it instantly for a fixed offer and certainty.
Make no mistake, the offer and the experience from the incumbent is going to be bad. They’re simply not set up to provide the same quality of service as Opendoor, and most likely will lowball the seller to protect their margins. But the offer will be present and it will appeal to some sellers.
The proposition from the incumbents will be poor, but it will be enough to soak up a portion of the demand in the market and take momentum away from Opendoor and other iBuyers. And if Opendoor can’t scale or if it becomes too expensive to attract new customers, it’s game over.
The more successful Opendoor becomes, the more incumbents will be forced to react, and when they do it will harm Opendoor’s growth and profitability.
Scaling challenges
Opendoor faces a number of challenges over the next 12 months. The most pressing of which is how the business scales nationally.
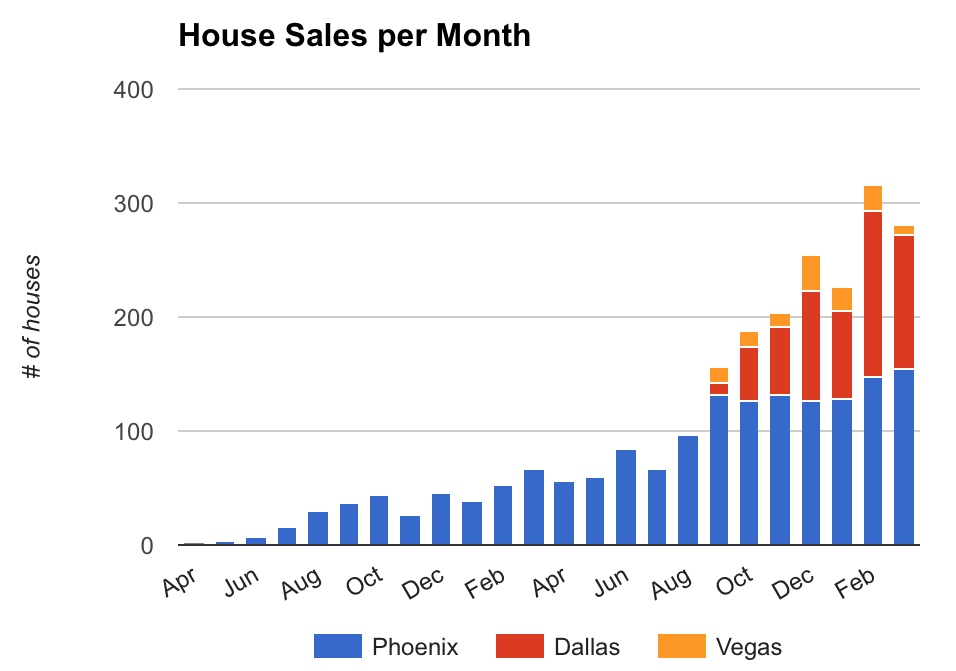
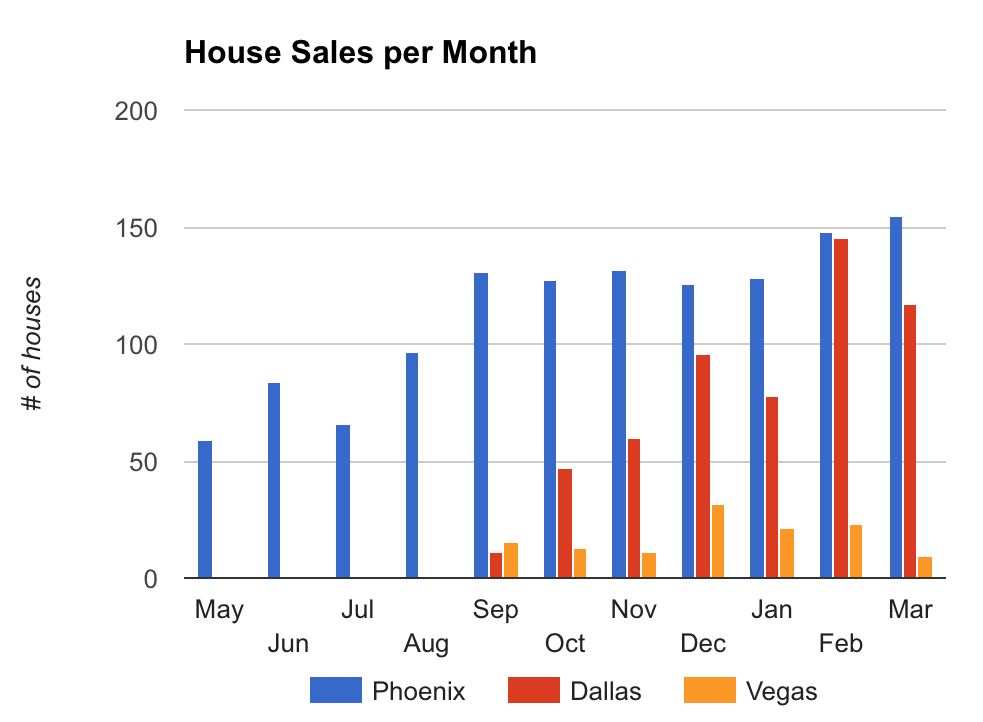
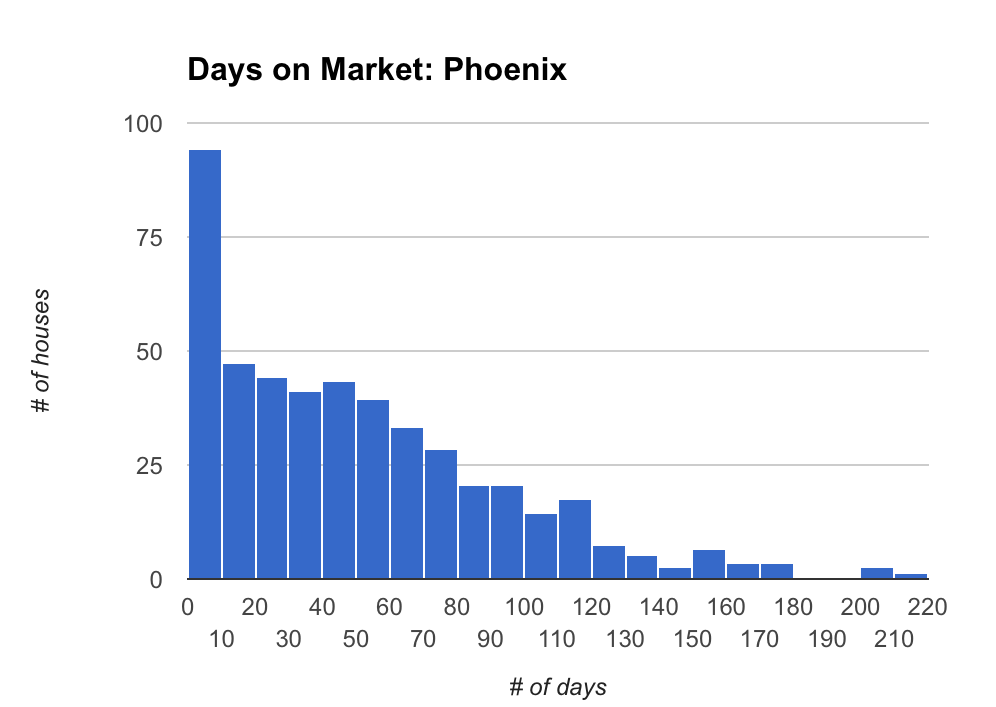
The previous two years have been spent proving out the model. Opendoor has been refining its processes in its two core markets, Phoenix and Dallas, trying a partnership model in Las Vegas, and just recently launched in Atlanta, Orlando, and Raleigh.
But 2018 is the big test: going national. I expect Opendoor to meaningfully be in ten markets this year. This will put a tremendous amount of pressure on the business, the management team, and the well-refined processes to see if they can all truly scale. It’s like NASA going to the moon after conducting tests in Earth’s orbit (which is exactly what they did). It’s a big step.
It will also be interesting to see how Opendoor approaches advertising. In the U.K., Purplebricks ran a national above-the-line advertising campaign (TV and radio) to build brand. That will be expensive in the U.S., but it’s a critical component to scaling the business, especially long-term customer acquisition costs. It’s also necessary to start building a moat between itself and its iBuyer competitors.
Opendoor will also face a significant challenge as it scales its people. As I mentioned above, scaling the business is resource intensive and is people dependent.
To win, Opendoor needs to provide exceptional customer service and needs to hire exceptional people. The more markets it expands to, the more people it will need. And the more people it hires, the more effort it will take to find exceptional people.
This contributes to the paradox. The larger Opendoor gets, the more difficult it will become to find quality people and maintain a high level of quality across a growing employee base -- all critical ingredients in delivering a superior customer experience.
The question of fees
Opendoor -- and its peers -- will also face ongoing challenges around its fees, both clearly explaining them to consumers and reducing them.
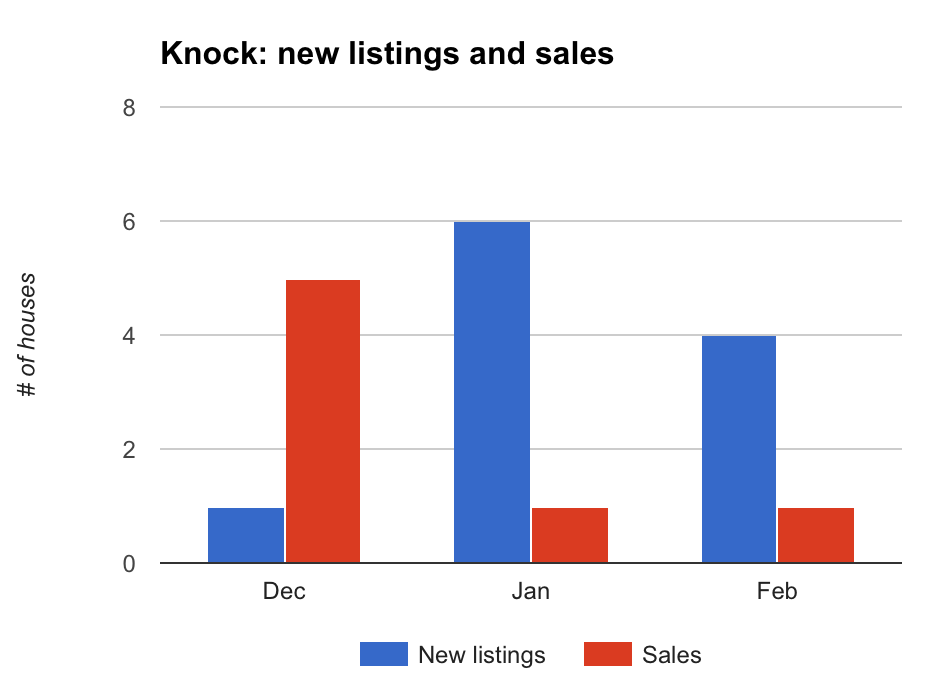
Opendoor needs to be price competitive with traditional real estate agents to succeed. The lower it can drop its fees, the more customers will flock its way. From the outside looking in, it appears to be doing this with the current fee structure, which happens to coincide with a noticeable uptick in activity in Q4 2017.

But more fundamentally, explaining fees is complicated. The pricing charts on Opendoor and OfferPad’s websites are long and complicated, as they attempt to explain holding costs, hidden costs, and somehow compare apples to oranges. If it takes more then five seconds to explain this to someone, you’ve already lost them.

Key strategic questions
Opendoor’s path forward is far from clear. As with all trailblazers, the future is uncertain, and in this case there are a number of threats. I believe the key strategic question -- and the area of utmost importance and absolute focus for Opendoor -- must be how to deliver the best experience possible to its customers.
Growth is key. Opendoor must reach scale for the business model to be sustainable and turn a meaningful profit. So it must venture forward aggressively, enter new markets, compete with fellow iBuyers, and be prepared to meet the incumbent’s threat head-on.
Opendoor must continue developing technology to automate the process (to improve efficiency) and deliver a superior customer experience (all-day open homes).
As it scales -- and because the business is so reliant on people -- it must attract and retain exceptional talent in each market it enters. This will be a key challenge, but not impossible. Maintaining a customer-focused culture with each new hire and each new contractor is easier said than done, but a critical task nonetheless.
And lastly, Opendoor must grow as efficiently as possible. It must continue reducing its fees and maintain its impressive operational efficiency. The holy grail would be combining the low-fee proposition of a Redfin or Purplebricks with the certainty of an iBuyer, but it may not be possible.
Growth comes with its own challenges and that is especially true of Opendoor. And as it grows, it will face the paradox of its greater and greater success bringing greater challenges to overcome. But only with great risk comes great reward.