
U.S. Markets Suggest Checkmark-Shaped Real Estate Recovery
/Past analysis has shown that the Covid-19 pandemic and associated lockdowns will cause a significant dip in real estate activity. The latest U.S market data shines a light on what the dip and recovery will look like -- a checkmark shape -- with an immediate drop, 3-4 weeks at the bottom, and a slow recovery period.

Recovery in the Front Line Markets
The effects of the dip are clearest in early-hit markets like Seattle in King County. It took approximately one week to hit the bottom, with another two weeks at the bottom before a rebound began. As expected, new listings are down 50 percent for the month compared to 2019, with a slow, 20 percent recovery each week.

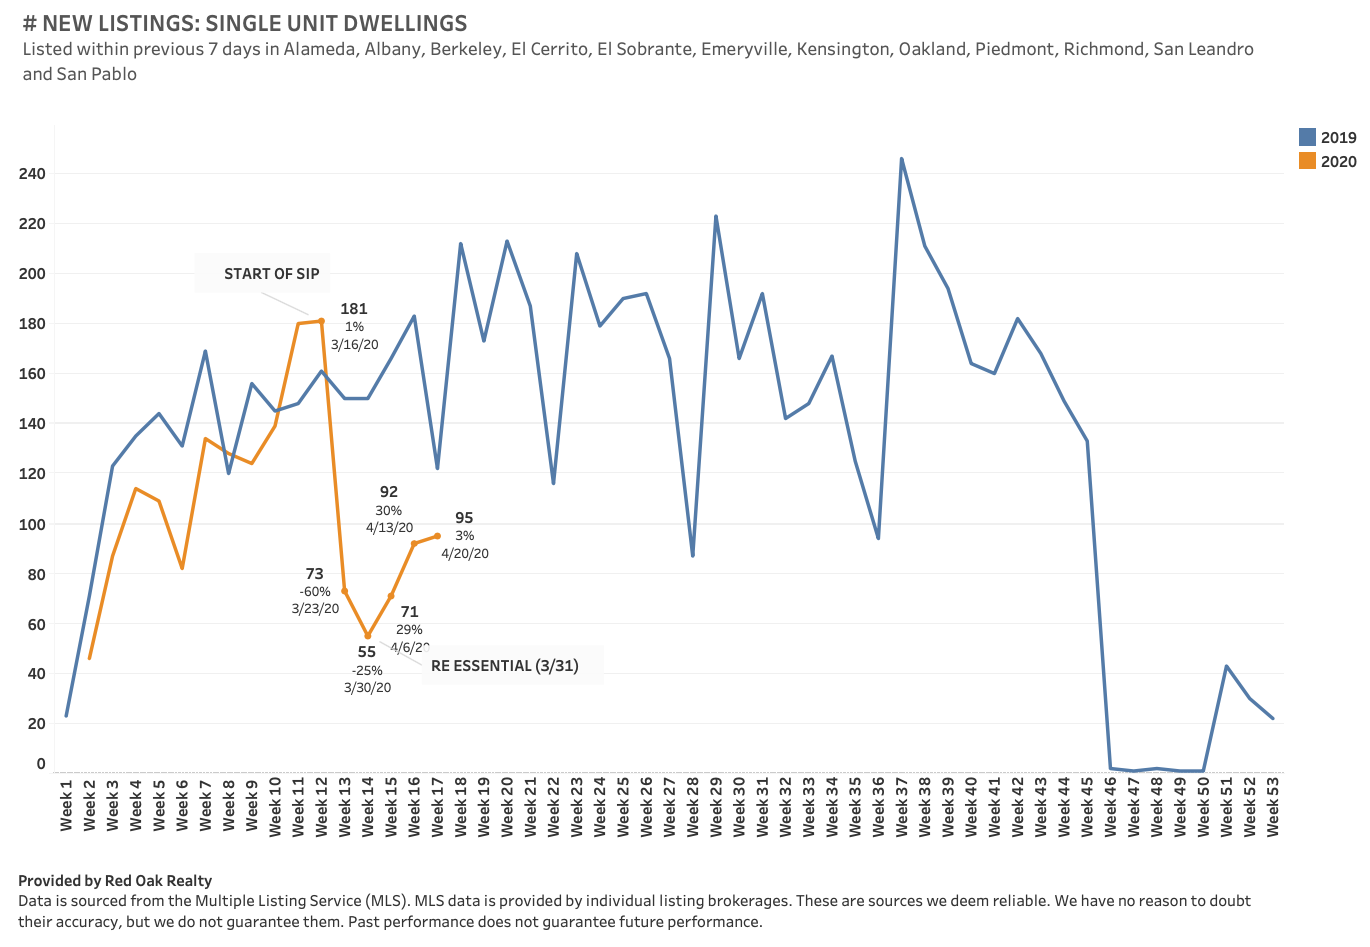
It is a similar story in California’s East Bay market. Once shelter in place orders were issued, it took only one week to hit the bottom. The dip lasted 2-3 weeks before a rebound in activity began. Like Seattle, the recovery is slow and gradual, with new listing volumes still down 50 percent from the previous year.
Dropping Activity in Secondary Markets
Markets like Austin and Portland experienced a different dip in activity. These cities were not on the “front lines” of the pandemic outbreak, and shelter in place orders followed behind the first hit metros like NYC, San Francisco, and Seattle.
Austin wasn’t hit with an extreme weekly decline of new listings, like Seattle and the Bay Area, but experienced the absence of an expected seasonal increase in activity. The result is 31 percent fewer new listings over the past four weeks compared to the same period last year. The nature of the dip is different from other markets, but the timing is similar: a week to get to the bottom, and 3-4 weeks at the bottom (so far).

Activity in Portland is similar. There is a noticeable weekly decline in new listings, coupled with a lack of seasonal growth. As with the other markets, it took about a week to get to the bottom of the dip, with 3-4 weeks at the bottom. New listings over the past four weeks are down 38 percent from the same period last year.

The New York City real estate market (specifically Manhattan, Queens, and Brooklyn) was especially hard hit. While the dip to the bottom occured in about a week, activity has remained bottomed-out for five weeks and counting, with no recovery in activity.

A Checkmark-Shaped Recovery
The dip occurs quickly. It only takes one week, maybe two, to hit the bottom of the curve in new listing volumes. The good news is that if you’re in a market that has seen a drop in new listing volumes, the first few weeks are as bad as it should get.
The stay on the bottom of the curve isn’t long. Most markets begin to see a recovery after 3-4 weeks. The exception occurs in markets like New York City that have more restrictive shelter in place orders.
Given the staggered timing of the pandemic, some cities are ahead of others in their recovery. This gives us a glimpse of what is likely to come. Please remember: Not all markets are equal, and the severity of the drop will vary wildly between them.

The recovery is not immediate; it is a slow, incremental recovery of 20-30 percent each week. It is too early to know for sure, but recovery to 2019 levels could take anywhere from 8-16 weeks. Markets in recovery mode are still down 30-50 percent from 2019 levels.

Rather than a V- or U-shaped recovery, the current evidence supports more of a checkmark-shape. It begins with a severe, immediate drop, lasts 3-4 weeks, and is followed by a gradual recovery.


