The Economics of iBuying, 2020 Edition
/With 2020 firmly behind us, the world's two largest iBuyers have released their full financial results for the year. Last week, we looked at their total financial losses. And today: A direct financial comparison of Zillow vs. Opendoor, and an individual look at the key points of difference from 2019.
An Overall Financial Picture
A comparison between Zillow and Opendoor highlights the tightening race between the two billion-dollar behemoths. In terms of revenue (which includes the full value of a home), Opendoor has managed to maintain a 50 percent lead over Zillow. But that lead is down from a whopping 250 percent in 2019.

Opendoor's 2020 experience was fluid. It managed to improve the efficiency of its business model, as measured by gross margin (driven by home appreciation and ancillary services), while reducing operational costs. This improved its contribution margin, but with robust overhead expenses, its net margin further deteriorated.

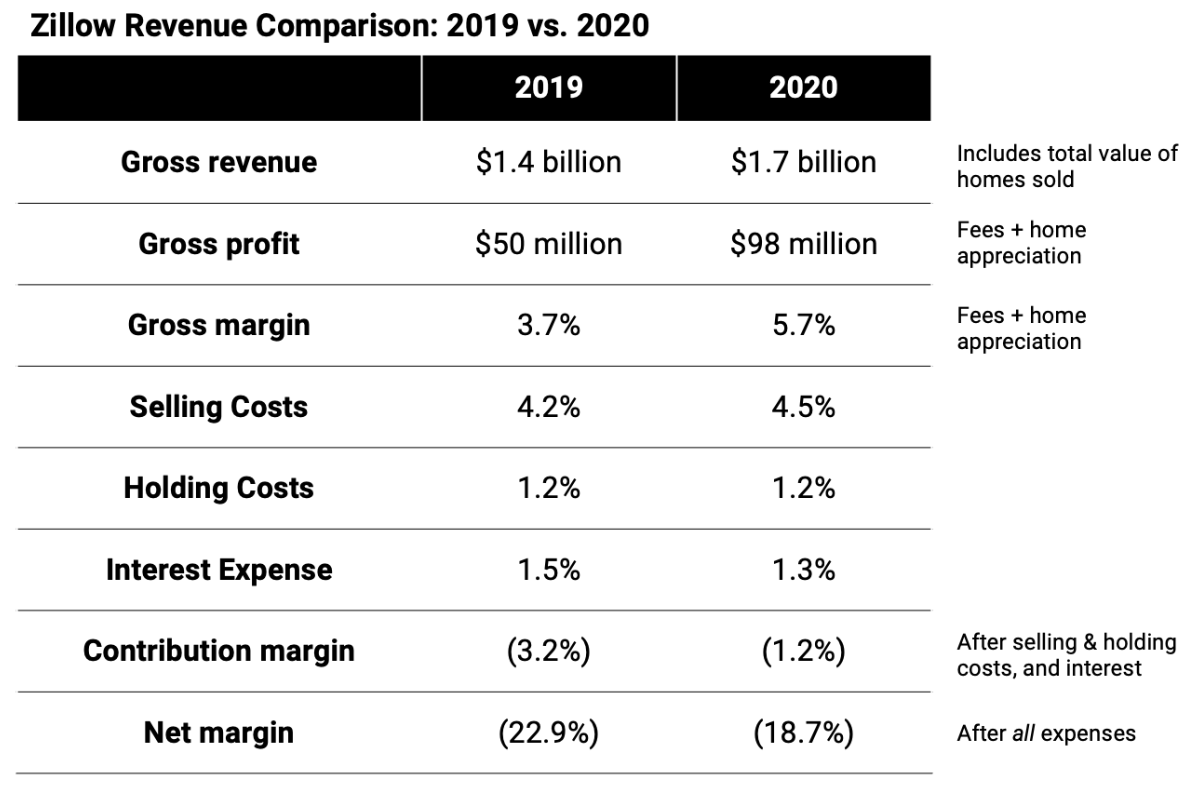
Zillow continued to grow its iBuyer business in 2020. It saw an increase in revenue and improved gross margins, with relatively static operational costs. It managed to reduce its overall net loss compared to last year.
The differences between Opendoor and Zillow, from a financial and unit economics perspective, are evident in the numbers:
Opendoor is better able to monetize the transaction (higher gross margins).
Zillow's Selling Costs are higher (due to the use of partner agents, an activity being phased out in 2021).
Opendoor is eking out small efficiency gains in Holding Costs and Interest Expense, an advantage that accumulates at scale.
Or, in other words: Opendoor is more operationally efficient, Zillow is catching up, and both companies remain unprofitable.
Unit Economics
The following charts, which are to the same scale, illustrate the economics above in a more attractive visual fashion. Amongst other things, they highlight how large indirect expenses are in both businesses.


While not necessarily hidden, neither company is guilty of highlighting its overall net losses nor the unprofitable nature of the business (a topic I discussed in iBuyers Turning Obfuscation of Profit into an Art Form). There are various forms of financial misdirection at play that highlight unit economics, Adjusted EBITDA, or other metrics that don't convey a complete picture of the business.
The point is not that these business are unprofitable and therefore must be bad. Spending (and losing) money to gain market share is a well-worn path. The point is that these companies are actively doing it, and if you're in the real estate industry, concerning yourself with disruptors willing to lose billions is a good use of time.