Can Opendoor Scale?


Opendoor, the original iBuyer and undisputed category leader, is laser-focused on scaling nationally and proving that it has a winning model.

Why it matters: Opendoor needs to demonstrate to investors that it has a credible path to profitability, and that as it grows it isn't just losing money faster. It needs economies of scale.

Opendoor reports a variety of financial metrics:

  • Net Loss is the total GAAP loss for the business.

  • Adjusted Net Loss backs out stock-based compensation expense ($536 million in 2021).

  • Adjusted EBITDA additionally backs out interest expense related to the purchase of homes ($140 million in 2021).

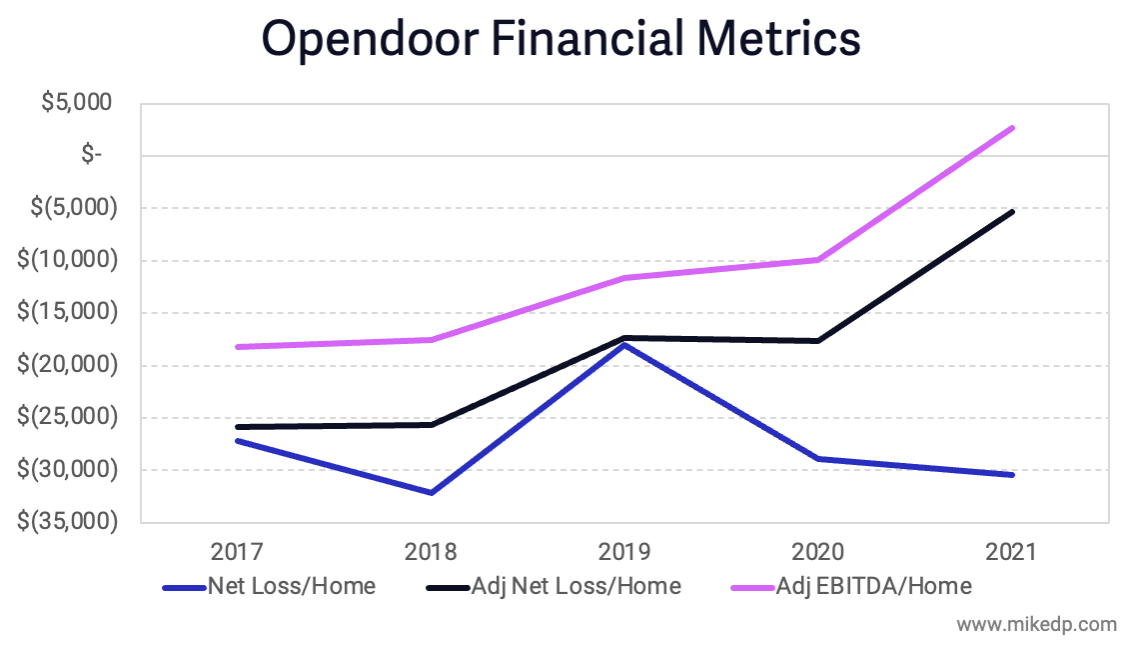
Now is not the time to debate the validity of each metric; let's consider all three. And to best illustrate economies of scale, let's divide each by the total number of homes sold in a period of time.


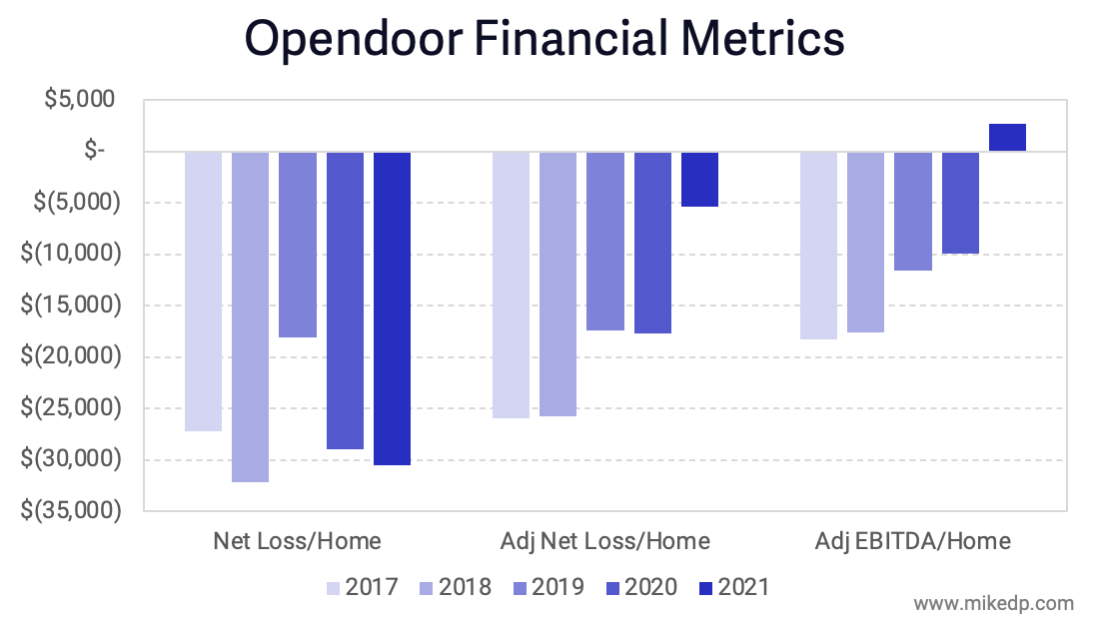
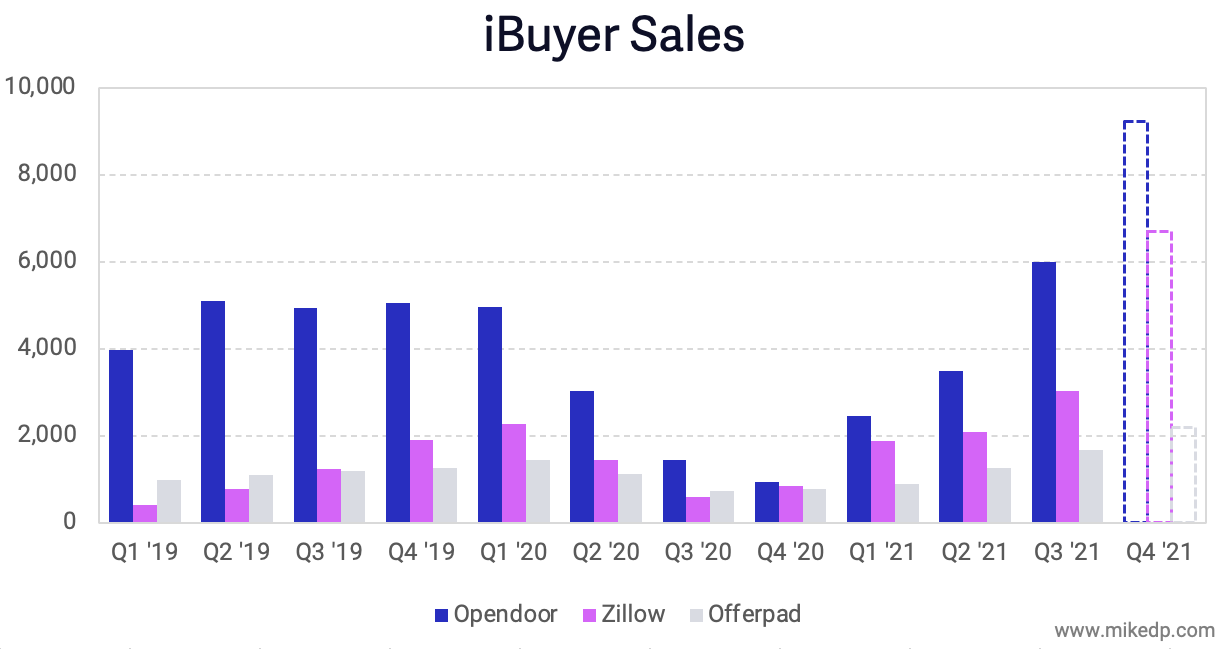
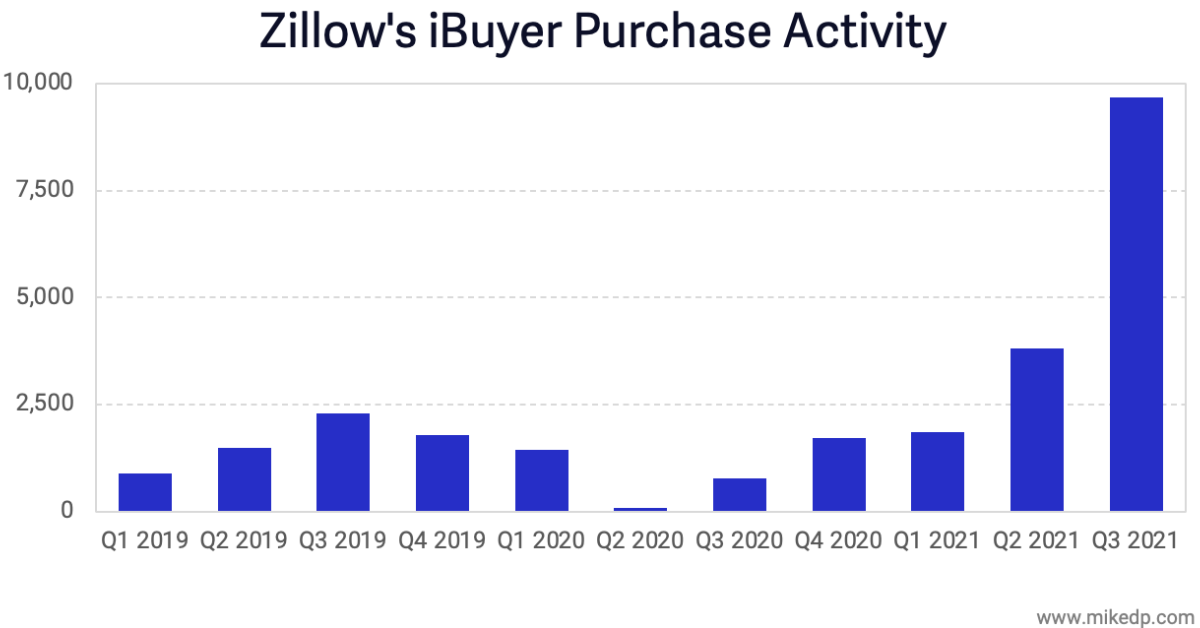
Improvement over time is clear. The key years are 2019 and 2021, when Opendoor sold a similar amount of homes: 19,000 in 2019 and 21,000 in 2021.

  • Opendoor's key metrics improved significantly between 2019 and 2021, with Adjusted EBITDA positive for the first time ever.

  • The exception is Net Loss, which bloated from $536 million of stock-based compensation expense related to its IPO.


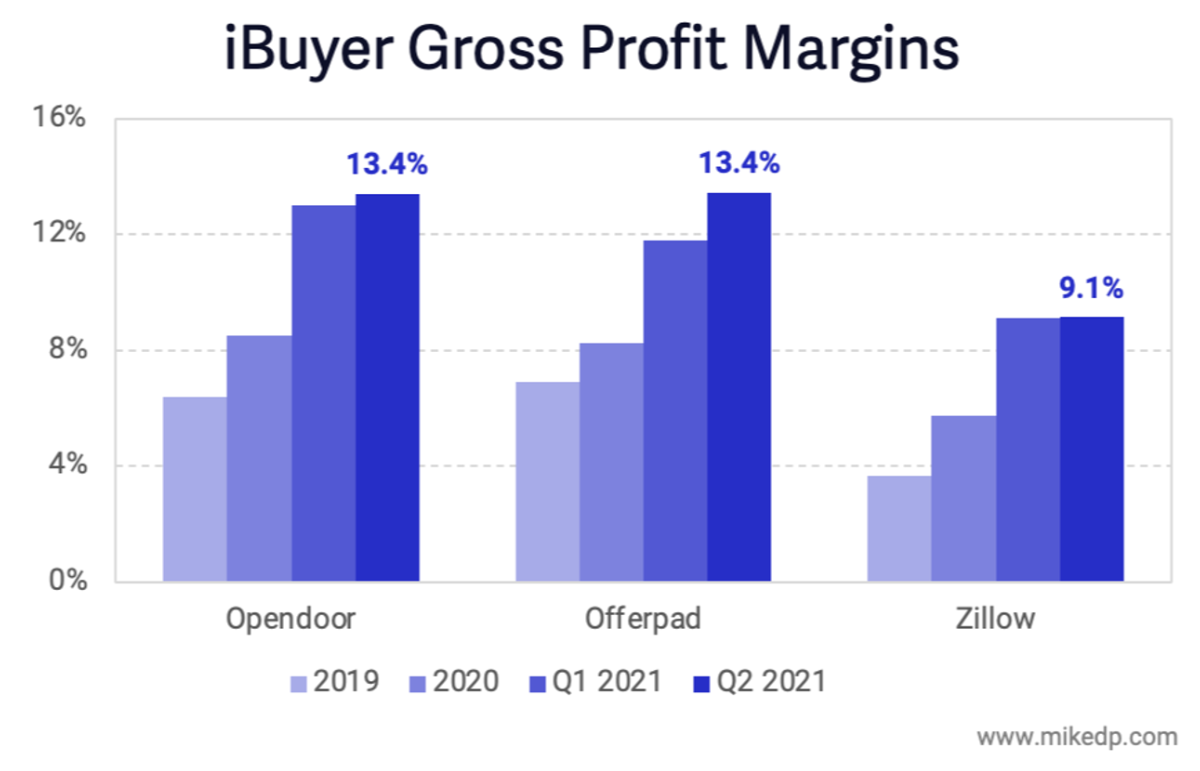
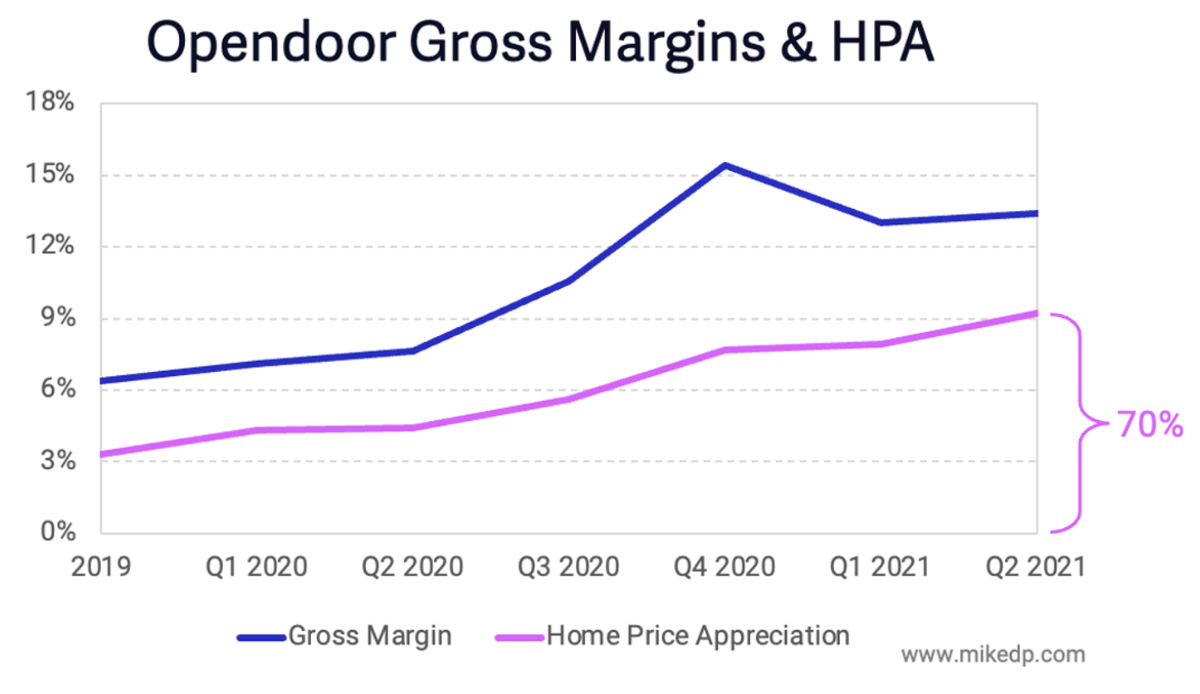
Yes, but: Opendoor benefited from record-setting home price appreciation in 2021, resulting in unusually high gross profits and contribution margin.

  • Let's consider an alternate reality, where contribution margin in 2021 was a slightly more modest five percent (instead of 6.5 percent).


The result is still an improvement from 2019, an important sign of Opendoor's ability to lose less money per home as it scales.

  • But it's still losing money. While economies of scale are improving, the business remains unprofitable.

The bottom line: The evidence suggests that Opendoor can scale, both operationally through a challenging market, and economically as it realizes efficiency gains.

  • If durable profitability is the goal, reaching it depends on further economies of scale, attaching adjacent services, and a favorable macro environment -- all of which are uncertain and only some within Opendoor's control.


Coming Soon: The 2022 iBuyer Report. I'm putting together a new, ~200 slide, evidence-based look at the evolving world of instant home buyers. Pre-order today and save 10%.

iBuyer Sales to Investors Soar


The major iBuyers sold approximately 20 percent of their inventory directly to investors in 2021, more than double the previous high in 2019.

Why it matters: These sales -- a growing part of the iBuyer business model -- mainly occur off market, meaning traditional home buyers never see them. And most of them are subsequently turned into rental properties.

By the numbers: This amounts to nearly 8,000 sales in 2021, a relatively small number, but one that has quadrupled since 2019.

  • Even though the number is small, it still matters -- especially to the thousands of families that missed out on the opportunity of homeownership.


All three of the major iBuyers sold significant portions of their inventory to institutional investors in 2021, with Opendoor leading the pack.


The big picture: Investors bought a record number of homes in 2021, and not just from iBuyers.

  • "Last year, investors bought nearly one in seven homes sold in America’s top metropolitan areas, the most in at least two decades," according to a Washington Post analysis.

  • "Those purchases come at a time when would-be buyers across the country are seeing wildly escalating prices, raising the question of what impact investors are having on prices for everyone else."

Fast forward: Opendoor's IPO documents set a goal of buying and selling upwards of 140,000 houses a year. Selling 20 percent to investors amounts to nearly 30,000 houses each year.

  • Taking inventory off the market, turning them into rentals, and reducing home ownership opportunities aren't part of the iBuyer narrative, but that's what's happening.

  • Selling to investors may be a sound business decision, but there are real world implications that directly affect thousands of American families.

iBuyer Market Share Soars in 2021


2021 was a transformative and record-breaking year for iBuyers. More houses were bought and sold by iBuyers than ever before.

Why it matters: iBuyers are one of the leading disruptive models in real estate. Their ability to grow, in all types of markets, is an important signal as to what degree the traditional real estate transaction can be disrupted.

  • But while 2021 saw record-high iBuyer transactions, it also saw the implosion of Zillow Offers after the business grew too quickly.

Big picture: iBuyer national market share of home purchases hit an all-time high of 1.3 percent -- around 70,000 houses -- in 2021.


iBuyer purchases remained robust as 2021 came to a close.

  • Even though Zillow stopped new purchases, it was on the hook to complete purchases that were already under contract.

  • Seasonality kicked in for Opendoor as it smartly slowed purchases after a massive acquisition spree in Q3.


Note: Q4 numbers are preliminary and subject to change.


iBuyer sales set new records in Q4, with more houses sold than ever before.

  • Opendoor consistently sold more houses each month, demonstrating an expanding operational capacity to repair and sell houses at scale.

  • This is a critical metric to watch. Buying houses is the (comparatively) easy part; selling at scale is difficult.


Note: Q4 numbers are preliminary and subject to change.


What's next: 2022 is all about profitability. Opendoor and Offerpad need to demonstrate that they can achieve consistently positive unit economics at scale.

  • With Zillow out of the picture, there will be less competitive pressure on fees and acquisition prices.

  • But Opendoor faces increasing competition from big incumbents, Power Buyers, and smaller brokerages, which have all launched similar products.

The bottom line: 2021 was a massive year for iBuyers. In particular, Opendoor is approaching the scale it promised during its IPO. If its economics fall into line, the company is poised to be a significant force in real estate.

Opendoor vs. Zillow: A Tale of Two Pricing Models

A catastrophic pricing failure sunk Zillow's iBuyer business. Clearly, home price appreciation is a key factor of the housing market in 2021 and beyond. And being able to accurately predict house prices -- not only today, but into the future -- is a non-negotiable prerequisite for iBuyers.

The best leading indicator of effective and accurate pricing is the buy-to-list premium; the difference between the purchase price and current listing price of a home. Unlike Opendoor, Zillow overpaid for the homes it acquired and is selling them for a loss; a negative buy-to-list premium, and a big problem.


Opendoor's median buy-to-list premium is rising once again, a sign of a healthy pricing and resale operation that is successfully reading the market.

While Opendoor's median buy-to-list premium is higher than Zillow's, the magic is in the distribution curve. Opendoor has a wide distribution of premiums that skews higher, leading to higher gross profits.


The finesse of Opendoor's pricing curve has been refined and improved over the past month. Not only has its median buy-to-list premium increased, but the percentage of listings with higher premiums has increased; the curve has shifted to the right.


A Matter of Timing

The buy-to-list premium is a leading indicator and a predictor of what is to come. The price a home sells for (buy-to-sale) is typically, but not always, a few percentage points lower than the listing price.

Even though Opendoor's buy-to-list premium is rising in Q4, its home price appreciation will be quite low for the quarter due to the intense pricing pressure of the previous quarter.

Strategic Implications

A comparison of Zillow Offers and Opendoor highlights the critical importance of pricing in iBuying. There's an understated elegance in the detail; it's not just buying low and selling high. A successful pricing operation -- not just an algorithm, but people! -- needs to work at scale, needs to improve over time, and needs to be more nuanced than a brute-force bell curve.

As the Zillow Offers collapse has demonstrated, pricing is a true potential competitive advantage for iBuyers. Getting it right is a prerequisite for success, while getting it wrong can lead to catastrophic failures.

iBuyer Market Share Rockets to New High

Before Zillow's meltdown, national iBuyer market share surged to another all-time high, blowing past all previous records by a wide margin. In Q3 2021, iBuyers accounted for 1.6 percent of all homes purchased in the U.S. That's around 28,000 homes, nearly double the 15,000 homes purchased by iBuyers in Q2.


The situation will certainly change with Zillow exiting the market and seasonality kicking in during Q4 2021. But for the time being, iBuyers have never been bigger, and Opendoor is now left as the undisputed category leader.

Also noteworthy: iBuyer Market share in Phoenix, the largest iBuyer market, peaked to a new high of 10.8 percent. This is the first time iBuyers have exceeded 10 percent market share in a major market -- a significant, if temporary, achievement.


Opendoor's Earnings: Painfully Normal

Both Opendoor and Zillow scaled their iBuying operations tremendously in Q3, but while Zillow's business spectacularly imploded, Opendoor demonstrated critical economies of scale. As it grows, its net loss per home is improving.


These charts show net profit/loss based on simple math: total net profit/loss for the business divided by the number of houses sold (excluding stock-based compensation expense). The result is a benchmark of business model efficiency.

While Opendoor and Offerpad improved their net profit/loss in 2021 (benefiting from record home price appreciation), Zillow's just got worse (and that's excluding the $304M inventory writedown) -- another reason Zillow Offers just wasn't working out.


As it scales, Opendoor's revenue (and gross profits) are increasing faster than fixed and variable costs. That's a positive sign, and something critically important to Opendoor's growth and profitability narrative.

Zillow Exits iBuying — Five Key Takeaways

Yesterday, Zillow announced that it is exiting its iBuyer business, Zillow Offers. After racking up over $1 billion in losses over 3.5 years, Zillow is closing the business down, a move that has significant implications for the real estate industry.

Zillow's Astronomical iBuyer Growth

Zillow's iBuyer business grew so fast, so quickly, that it literally broke the company, forcing an abrupt shut down. In Q3 -- the three months that broke the business -- Zillow purchased more houses than in the previous 18 months combined.


This is the type of growth that can stress a business to its breaking point, which is exactly what happened.

This Was A Zillow Problem

Zillow's shareholder letter cites "higher-than-anticipated conversion rates" and "unintentionally purchasing homes at higher prices" as reasons for its failure. Both are execution issues that are critical ingredients to iBuying, and appear to be unique to Zillow.

Zillow's unintentional purchase of homes at high prices contrasts nicely with Opendoor's intentional purchase of homes at lower prices. Beginning in July, as the market began to cool, Opendoor and Offerpad began paying less for homes, while Zillow continued to pay top dollar.


(I've removed the y-axis in the above chart to focus on what's really important: change over time, and the relative difference between iBuyers.)

Since inception, Zillow has struggled to make structural operational improvements to its iBuying business. Zillow's gross margins -- which are a combination of purchase price, sale price, renovation costs, and service fee -- have consistently remained below its peers. Why? The others are just better at iBuying.


Earlier this year, when home price appreciation was at record highs and the other iBuyers flirted with profitability, Zillow continued posting massive losses.


iBuying is incredibly hard (it's real estate!). But while its peers managed incremental operational improvements over time, Zillow did not.

What's Next: Zillow 3.0

While Zillow 2.0 may have been a failed experiment in iBuying, what captures the imagination is the next iteration of the business. How will Zillow leverage its massive competitive advantage and its iBuyer learnings for Zillow 3.0?

I wouldn't be surprised to see Zillow play deeper in the Power Buyer space, a model that is asset-light, easier to scale, less risky with better unit economics, and has a natural overlap with Zillow Home Loans (Opendoor diversified into Power Buying earlier this year).


Zillow as a Power Buyer -- either through organic development, partnership, or acquisition -- is a natural extension to its existing business of helping home buyers. The world of real estate has evolved significantly since 2018, and Zillow needs to stay relevant to those evolving consumer needs.

Opendoor's Pyrrhic Victory?

With Zillow's exit, Opendoor is left as the undisputed iBuying champion. But is it a battle worth winning? Zillow's exit is a mixed blessing for Opendoor, and puts the spotlight on Opendoor's path to profitability.

On the one hand, Zillow's absence from the market will relieve some competitive tension, allowing Opendoor to make slightly lower offers and charge slightly higher fees. There should be a small, positive effect on margins (which Opendoor needs more than ever).

But on the other hand, Opendoor is now going it alone, no longer able to piggyback off Zillow's consumer education efforts (advertising) in new and existing markets.

Opendoor has thrived in a high home price appreciation (HPA) market, driving gross margins to record highs. But with HPA dropping, what will happen to Opendoor's gross margins? Will it "make it up in volume," or will losses compound as it scales?


Black is the New Red

Zillow's decision to close its iBuying business is a victory for rationalists everywhere. For years, investment in real estate tech has frequently defied reason, prioritizing a company's ability to grow over profitability (watch my presentation, "How to Lose A Billion Dollars in Real Estate Tech"). Sustained unprofitability was the new competitive advantage and red was the new black.

But perhaps this is a turning point. For investors in Zillow, Opendoor, Compass, and a score of others, at some point enough is enough; a credible path to profitability is needed. For Zillow, this -- and losing a cool billion -- is that point.

I, for one, welcome the reintroduction of rational investment thought back into real estate. Let this be a welcome wake-up call for investors and the industry.

Priced to Sell: Zillow’s Inventory Problem

In my previous analysis, iBuying is Hard: Zillow Pauses New Purchases, I suggested that iBuyers can get into trouble if they overpay for too many houses in a cooling market. This results in a growing inventory of overpriced houses that are difficult to sell, which is exactly the problem Zillow now faces.

In Phoenix, Zillow's 250 current listings are priced at a median of 6.2 percent below what they were bought for (the "buy-to-list" metric).


(As a point of reference, iBuyer median home price appreciation -- buy-to-sell -- was around 8 percent earlier this year. In Phoenix, it was around 10 percent just a few months ago.)

Put another way, Zillow's Phoenix inventory is currently priced at a median of $29,000 less than the buy price. This is a direct result of price reductions on 182 listings of an average of $41k.


The trend is similar -- but not as bad -- in other markets. In Atlanta, Zillow's median buy-to-list is still positive, but down considerably from past months (and again worse when compared to Opendoor).


Buy-to-list is a metric that should be, and up until recently was, positive. On average, being able to sell a house for no less than it was bought for is table stakes for iBuying. A loss of $29k on each house -- before any other expenses are accounted for -- represents a catastrophic failure in pricing.

Perspective

There are a number of ways to read the situation. Yes, Zillow screwed up. Yes, Opendoor looks impressive in comparison. And yes, there are challenges with iBuying in a cooling market. In the microcosm of one iBuyer, in one market, in one month, the situation looks dire.

But it won't stop Zillow; the loss, relative to its total investment in iBuying, is small. Sold today, Zillow’s Phoenix listings would incur a loss of $7 million. That’s a fraction of Zillow’s total iBuying losses of this year and last.


This is a company that is willing and able to lose hundreds of millions of dollars to invest in and build a new business. A $7 million loss in one market during one month will be a distant memory by this time next year.

The iBuyer investment case for Zillow, Opendoor, and others is clear: this is an opportunity measured in trillions, not billions, of dollars. Within the context of long-term industry disruption, this may simply be an embarrassing detour on Zillow's inexorable march to transform real estate.

Special Thanks

The data collection for this analysis came together quickly with the help of several friends. Thank you to Rich Mackall, Oscar Castaneda, Sarah Perkins, and Divvy Homes!

iBuying is Hard: Zillow Pauses New Purchases

Zillow announced that its iBuyer operation is paused for new business, and will not sign any additional contracts to buy homes through the end of the year.

Unprecendented Growth

Last quarter, the iBuyers purchased more houses than ever before. Preliminary market data -- which is so high I have to make note of how unusual it is -- shows another record-breaking quarter. In fact, if true, it would represent absolutely stunning growth to a scale the iBuyers have talked about but have yet to achieve.


If the public record data is accurate, Zillow purchased more than twice the number of houses in Q3 compared to Q2 (which itself was double Q1). This is the type of growth that can stress a business to its breaking point.

Missing the Signs

Aside from the massive human capital implications of scaling a business so quickly (real estate transactions are complex and people-dependent), the iBuyers can get into trouble if they pay above market for too many houses in a cooling market. This results in a growing inventory of over-priced houses that are difficult to sell.

Zeroing in on Phoenix offers a snapshot of the importance of reading and reacting to these changing market conditions. When Phoenix started to cool, Opendoor and Offerpad began to adjust by slowing down purchases. Zillow, however, did not.


As the market cooled between August and September, Opendoor and Offerpad purchased fewer houses, while Zillow purchased more.


Adjusting Prices

The iBuyers also adjusted to changing market conditions by paying less for houses. The median purchase price in Phoenix peaked in August. Opendoor and Offerpad's median purchase price also peaked in August before tracking the market and declining in September. But Zillow kept paying more and more.


Zillow continued to purchase homes well above the market median -- a full $65k higher in September. It continued to pay top dollar to fuel acquisitions at a time when the market was cooling and other iBuyers were pumping the brakes.


Strategic Implications

Growing pains. Off the rails. Ahead of your skis. Any of these phrases could apply to the situation at Zillow (or any number of other high-growth companies).

The iBuyers -- Zillow included -- experienced massive, transformational growth in 2021. And while Zillow stumbles, Opendoor appears to be firing on all cylinders and flexing its well-honed operational muscle as it reaches new highs.

The current problem seems to be unique to Zillow. The other iBuyers saw the signs and made strategic adjustments months in advance. Zillow either missed the signs, or decided to proceed despite them.

Which leads to the current situation: embarrassing, clearly not ideal, but also not the end of the world. A timely reminder that iBuying is an incredibly difficult business to scale, and when you move too fast, sometimes things break.

The Real Estate Disruptors Serious About Mortgage — A 10x Story

Real estate tech disruptors are investing billions to build integrated brokerage and mortgage experiences. Some have more resources than others, but all have the same scaling bottlenecks. And in the end, the biggest disruptors -- and who is most at risk -- may come as a surprise.

The Bottlenecks to Scale

Each company employs licensed brokers -- Mortgage Loan Originators (MLOs) -- that occupy a critical position in securing or refinancing a mortgage. As with real estate, people remain a central component of the mortgage process, and no amount of technology, venture capital, or inspirational vision has yet to replace them.


MLOs are both a key component and a bottleneck for the iBuyers, Power Buyers, and others attempting to attach mortgage to their core services. The speed at which they hire MLOs, and the total number employed, is a reflection of how serious they are and their potential to grab market share.


Homeward and Knock, fresh off big funding rounds, are quickly growing. Newcomer Tomo is moving fast. Notably, the iBuyers remain relatively small. There is no outsize leader...until real estate portal Zillow is added into the mix.


Zillow has nearly 10x the MLOs of its smaller competitors, giving it significantly more scale and firepower for its integrated mortgage plans. Zillow is the top player...until pure play digital disrupter Better Mortgage is added into the mix.


Better Mortgage has raised nearly $1 billion in its quest to disrupt mortgage, and has nearly 10x the MLOs of Zillow. Significant firepower and scale, and clearly the top player...until industry behemoth Rocket Mortgage is added into the mix.


Ten MLOs to ten thousand MLOs. And: The number of MLOs roughly corresponds to closed loan volumes: $1.2 billion for Zillow, $14 billion for Better, and $65 billion for Rocket in Q1 2021.

Who's Disrupting Whom?

Both Rocket and Better recently announced they're hiring in-house real estate agents, which raises an interesting question about who's disrupting whom. Real estate tech companies are going after mortgage, but now mortgage is going after real estate.


These companies all have different approaches, but the destination is the same: an integrated real estate experience that seamlessly combines mortgage and brokerage. And the key execution trends are clear: in-house agents and MLOs, paired with deep discounts for consumers.

Perhaps the true takeaway is that those companies not included on the chart are the ones at risk. Whether it's being initiated from the real estate or mortgage side, both components are being smartly combined to provide an integrated, highly convenient consumer experience. The companies unable to provide that are the ones at risk.

iBuyer Profits At Risk With Falling Home Price Appreciation

U.S. iBuyers are closer than ever to profitability. Offerpad just posted a profitable quarter, and if stock-based compensation is excluded, so did Opendoor. But the overwhelming majority of profits are coming from record home price appreciation, which is temporary, and appears to be falling.


Home price appreciation (HPA) has always been a component of an iBuyer's gross profit; it is the spread between the purchase and resale price of a home. And it's significant: In Q2 2021, home price appreciation accounted for 70 percent of Opendoor's gross profit margin.


Over time, home price appreciation is becoming a larger component of Opendoor's gross profit margin -- rising from 50 percent in 2019 to 70 percent in Q2 2021.


What Goes Up Must Come Down?

Home price appreciation rates are beginning to cool in major markets across the U.S., including Phoenix, where the median iBuyer home price appreciation has fallen 50 percent since May. Opendoor's median home price appreciation for homes sold in August is just 2.7 percent, down a massive 75 percent from 10.7 percent in May.


The decline will certainly have a material impact on iBuyer gross profit margins, which have reached record highs during 2021.


Opendoor's gross margins have increased an impressive 700 basis points, from 6.4 percent to 13.4 percent, between 2019 and Q2 2021. But 84 percent of that improvement is from rising home price appreciation (3 percent → 9.2 percent).


Strategic Implications

Gross profit margin includes an iBuyer's service fees, home price appreciation, and repair costs (and in the case of Opendoor and Offerpad, also includes revenue from ancillary services like title insurance, mortgage, and brokerage services).

The iBuyers' recent profitability is being driven by record home price appreciation -- a temporary artifact of a hot housing market. As the market eases off its red hot highs, slowing price appreciation may have an adverse effect on iBuyer profit margins.


Thanks to Sarah Perkins of Lawyers Title (check out her real estate updates at theazmarket.com), for helping me dig through tax records.

iBuyers: Paying Above Market and Reselling For More Upside

With unprecedented demand and constrained supply, house prices are rising across the U.S. Consequently, the iBuyers -- led by Opendoor, Zillow, and Offerpad -- are paying record-high, above market values for the homes they’re purchasing from homeowners. But they're also reselling them for more money than ever before.

Purchase Price-to-AVM

Purchase Price-to-AVM is a comparison of the price an iBuyer pays for a house compared to what an AVM (automated valuation model) determines the house is worth at the time of purchase. This study uses the ATTOM Data AVM.

Historically, iBuyers paid a point or two below “market value.” My previous research study, conducted in 2019, found a median Purchase Price-to-AVM of 98.6 percent for Opendoor and Zillow. But things have radically changed in 2021; the number is well over 100 percent, with Opendoor paying a median of 107.7 percent in Q2 2021.


To be fair, most of the market is paying above "market value" in the housing frenzy of 2021. And for iBuyers, this trend has accelerated over the past six months, led by Opendoor. As a newly-listed public company, Opendoor needs to demonstrate strong revenue growth, and the only way to do that is by buying and selling more houses.


This shift -- and Opendoor’s strategy -- is clearly visible when analyzing its Purchase Price-to-AVM distribution compared to Zillow. In 2020, both companies were nearly identical, with a median Purchase Price-to-AVM of around 98 percent.


But in the first half of 2021, Opendoor materially shifted to the right, paying, on average, significantly higher prices for houses.


Over the past 18 months, Opendoor has clearly shifted to paying more for homes, with a much looser price distribution than the past.


The above chart can be interpreted a number of ways: houses are getting more expensive (they are), Opendoor is paying more for houses (it is), and pricing is becoming harder to predict with an AVM. But there also appears to be a shift from the tight pricing discipline of 2020 to a free-for-all, acquire at any cost strategy.

The trends adhere to the fundamental principles of supply and demand: with housing in short supply, iBuyers need to increase the quality of their offers. But this doesn't negatively affect their margins; in fact, iBuyers are reselling homes for more money than ever before.

Rising Price Appreciation

Once an iBuyer purchases a house, they quickly spruce it up and resell it -- ideally for more than they bought it for. This difference, the spread between the purchase and resale price, is price appreciation.

In 2021, the median price appreciation for iBuyer transactions is 8.1 percent -- a record high -- up from 4.7 percent in 2020 and 3.3 percent for Opendoor and Zillow in 2019. And it continues to climb, with Opendoor hitting 9.2 percent in May 2021.


Combined with 2021's 40 percent increase in the median value of homes purchased by iBuyers, price appreciation approaching 10 percent is financially significant.

Consider: median price appreciation of 3.3 percent on a $250k home in 2019 is $8,250, compared to 9.2 percent (Opendoor's price appreciation in May 2021) on a $350k home, which is $32,000.

And the results vary by market. An analysis of 262 iBuyer transactions in Phoenix during May and June shows a median price appreciation of 11.5 percent, or $39,000, after a median of just nine days on the market (total hold time is about two months).


It's no wonder that iBuyers are happy to pay more for houses and abandon their tight price discipline; they're more than making up for it on the resale.

A Note on Data Sources

The data above is primarily sourced from national public property records, with some data from the Phoenix MLS. Price appreciation is calculated by taking the percentage difference between sale price to purchase price for matched properties, and then taking the median value of those transactions. It is based on over 20,000 transactions between January 2020 and May 2021. Thanks to my good friend Suhel Mangera for his assistance crunching the data.

For more, zavvie's recent Seller Preferences Report does a good job of tracking iBuyer offer quality, fees, concessions, and other data that's relevant for consumers.

iBuyers Are Back: Purchase Volumes and Prices Soar to Record Highs

After a brief interlude last year, iBuyers are back in a big way. The iBuyers have bought more houses, at higher prices, in Q2 2021 than in any other quarter. Opendoor purchased more houses in the past three months than in all of 2020.


For anyone concerned that the iBuyer model wouldn't be popular in a seller's market, the evidence shows that it is resonating with consumers more than ever, and market conditions are in fact fueling its growth.

$350k is the new $250k

iBuyers are paying more for houses than ever before. The median purchase price of a home bought by Opendoor, Zillow, and Offerpad climbed to $350k in May, up from a steady-state median of $250k for the past several years (the iBuyer "sweet spot").


The iBuyers are still generally purchasing the same types of houses, they're just worth a lot more (+40%) due to the hot housing market. The median iBuyer purchase price closely tracks that of the overall U.S. market.


A more granular analysis shows dramatic shifts in price distribution. In the past 18 months, the percentage of homes purchased by iBuyers under $250k has plummeted from 55 to 13 percent, while the percentage of homes purchased for more than $500k has jumped from 3 to 24 percent.


This is a significant shift in the underlying economics of iBuying that affects revenues, gross profit, financing, inventory value, and more. For example, in Q1 2020 Opendoor sold around 5,000 homes. At an average of $250k each, that's around $1.2 billion in revenue. But at an average of $350k, revenue would be $1.7 billion -- a 40 percent increase driven by home values alone, and not volume.

The iBuyers will have blow-out quarters with record revenues, driven by high purchase and sale volumes and the rise in home values. iBuying is back in a big way.

A Note on Data Sources

The data above is sourced from national public property records. There is a timing delay, which means the June numbers may be slightly high or low. But the difference shouldn't take away from the major narrative of record volumes for the quarter.

Opendoor's Mortgage Attach Rate Jumps, But At What Cost?

A key component of the long-term profitability of iBuyers is their ability to attach adjacent services such as mortgage and title insurance. Opendoor's mortgage attach rate in Arizona has recently shifted dramatically -- up from around two percent during the past 18 months, to nine percent in April and a record 12 percent in May.


While the improvement is significant, there are a few points worth clarifying:

  • While the percentage is high, the raw numbers are low. May's numbers equate to about 19 transactions where Opendoor sold a home and attached its Opendoor Home Loans product.

  • Attach rates and loan numbers in other markets remain low (roughly two percent attach in Texas). In May, there were five transactions attached to Opendoor Home Loans outside of Arizona.

  • As context, a 12 percent mortgage attach rate is an improvement, but still well-below industry averages and the Power Buyers.

The Cost of Gaining Market Share

Opendoor is making impressive gains in Arizona, but what's driving the momentum? It appears to come down to financial incentives: Opendoor is offering an additional two percent discount to buyers that use Opendoor Home Loans. As of writing, this promotion appears to be live in the Phoenix and Atlanta markets.


Opendoor offered the following table to prospective buyers (and their agents), showing the savings when using Opendoor Home Loans.


The challenge with these discounts is that Opendoor is giving away all of its margin to gain market share. In its investor presentation, Opendoor states a target margin of $5k on home loans -- which instantly disappears with a two percent back promotion.

 
Screen Shot 2021-07-22 at 7.56.08 AM.png
 

Opendoor's rising mortgage attach rate in Arizona appears to be the result of significant financial incentives, or a "let's throw money at the problem" strategy.

Strategic Implications

There are two sides to Opendoor's "Throw Money At It" strategy. On the one hand, Opendoor effectively has unlimited access to capital, and is leveraging that competitive advantage by competing where it can win.

On the other hand, throwing money at the problem is a relatively unsophisticated, brute-force approach to gain traction and demonstrate top-line growth -- but at what cost? How valuable is a service if you need to pay people to use it?

Losing money on the core iBuyer transaction with hopes of making money on the mortgage (which is also losing money), doesn't balance out. Two loss leaders don't make a profit. For any company attempting to generate profits from adjacent services, and there are a lot, mortgage remains hard; it is no panacea for profitability.

iBuyers Beginning to Target the Northeast Market

The Northeast is the major population center of the U.S., but has remained untouched by disruptive new models in real estate -- until now. Opendoor, Zillow, Offerpad, RedfinNow, and Orchard are establishing the first footholds in this potentially lucrative market. Traditional agents and brokers have had years to prepare -- are they ready?

 
Screen Shot 2021-06-29 at 7.53.31 AM.png
 

The strongest iBuyer markets are centered in the West, Southwest, and South -- basically everywhere except the Northeast and Midwest. These markets, with older housing stock and longer winters, are more difficult to crack.

Major iBuyer Markets

 
Screen Shot 2021-06-28 at 10.36.16 AM.png
 

But it's no secret the iBuyers (and other models) plan to enter the Northeast. Opendoor's investor presentation clearly laid out the playbook and plan of attack, which includes expansion into the Midwest and Northeast corridor.

Opendoor's Target Markets

 
Screen Shot 2021-06-28 at 10.35.52 AM.png
 

Based on a pair of recent job postings, it appears that Opendoor is starting in Washington D.C., Virginia, and Maryland -- a market that RedfinNow and "Power Buyer" Orchard also entered earlier this year.


In early 2021, RedfinNow was the first iBuyer to launch in Boston. Meanwhile, Offerpad is expanding through the Midwest, recently announcing a launch in Columbus. This sits alongside Zillow Offers' presence in Cincinnati, a market launched in 2020.

 
14f3eae7-9d66-0188-1539-e910c8ae05af.png
 

Strategic Implications

Traditional real estate agents located in the Northeast and Midwest have had years to watch and learn. Billion-dollar disruptors are coming, featuring new models like instant offers, cash offers, and buy before you sell programs.

The Northeast accounts for 17 percent of the U.S. population, and local realtors can be zero percent forgiven for ignoring the coming disruption. Change is happening (slowly) and smart agents are adapting to that change. No market is immune. What's your plan? (Hint: Compete Where You Can Win).

Offerpad and Its More Profitable Flavor of iBuying

The Offerpad story presents the clearest signal yet that iBuying can become profitable. Its latest Q1 2021 numbers show a business only losing $230 per home bought and sold -- a breathtaking achievement compared to losses of tens of thousands of dollars per home at Opendoor and Zillow.


All up, on a GAAP basis, Offerpad's Q1 net loss was just $233k, compared to $58 million for Zillow Offers and $270 million for Opendoor. Staggering differences.

Background

Following Opendoor, Offerpad was the second iBuyer to launch in the middle of the last decade. In terms of size, it was eclipsed by Opendoor but has maintained parity with Zillow, buying and selling more than 4,000 homes per year.

 
Screen Shot 2021-06-07 at 8.52.19 AM.png
 

Offerpad's version of iBuying stands out because it is losing radically less money than its peers. Offerpad's overall net loss per home is significantly lower than Zillow and Opendoor -- $5,400 compared to Opendoor's $29,000 in 2020. And it's overall net loss in 2020 was $23 million, twelve times smaller than Opendoor's $286 million.

 
Screen Shot 2021-06-07 at 8.53.37 AM.png
 

Comparing Unit Economics

Financially, there are two possible explanations for this difference: either Offerpad is generating more revenue, or it is incurring less expense, per home bought and sold.

On the first point, the evidence suggests nearly identical revenue generation at Offerpad and Opendoor, as measured by gross margins (this accounts for purchase price, sale price, renovations, and ancillary services).

 
Screen Shot 2021-06-07 at 8.52.06 AM.png
 

Both companies are tracking above Zillow, with all iBuyers seeing significant gross margin gains in Q1 2021 due to higher home price appreciation in the current market (and Opendoor is almost certainly benefiting from withholding new listings in 2020).

Offerpad and Opendoor have very similar direct costs as well (as measured by selling costs, holding costs, and interest expense in the charts below). The primary difference appears to be in each company's indirect expenses.


The unit economics between the two companies are nearly identical. But as a percentage of revenue, Offerpad's indirect expenses were 5.5 percent in 2020, compared to Opendoor's 14.6 percent (and Zillow's 17.5 percent). This is the key difference driving profitability.

Indirect Expenses

Each company has three main expense lines:

  • Sales, marketing and operating

  • General and administrative

  • Technology and development

Sales, marketing and operating generally scales with volume; it includes selling costs, holding costs, and other costs directly involved in the transaction. General and administrative consists of corporate overhead like executive and admin salaries and rent, while technology and development includes all tech costs, including headcount.

The iBuyers have vastly different approaches to their technology investment; Opendoor is spending about eight times more on technology and development than Offerpad (and both companies are dwarfed by Zillow -- but given Zillow's wider technology ecosystem, I'm going to focus on an Opendoor comparison).


Since 2018, Opendoor has invested over $150 million into technology, compared to just over $20 million at Offerpad.

Offerpad's General and Administrative (G&A) expense -- think of it as general corporate overhead -- is also well below its peers. Again, Opendoor is outspending Offerpad by a factor of eight.


The differences in investment aren't explained by volume. In 2019, Opendoor sold about 4x the houses as Offerpad, but its overhead and tech costs were about 7x higher. In 2020, Opendoor sold about 2x the houses as Offerpad, and its overhead and tech costs were about 8x higher (a trend that continues into 2021).


Certainly each company has slight variations on how it accounts for expenses, but the overall narrative is clear: In aggregate and on a per unit basis, Offerpad is spending a fraction of what Opendoor is on technology and corporate overhead, resulting in significantly lower indirect costs.

The Impact of Technology

How does Opendoor's $150 million technology investment compare to Offerpad's $20 million? Looking at the bottom line, the results show a negligible difference and no competitive operating advantage.

I would expect technology development to allow iBuyers to more accurately price homes, improve operational efficiency, or reduce expenses -- but Offerpad and Opendoor have nearly identical unit economics and direct selling costs (Opendoor's gross margin advantage is being driven by home price appreciation, which is a gravy train that won't last forever).

Two Teams, Two Approaches

Offerpad and Opendoor are illustrating two different approaches to iBuying specifically, and venture-fueled disruption more generally.

Each company raised radically different amounts of venture capital before becoming public companies. At $1.3 billion, Opendoor had nearly 10x the capital to grow the business compared to Offerpad. The amount of capital raised is a direct result of differing growth mindsets, and has enabled two different growth strategies.

 
Screen Shot 2021-06-07 at 9.00.35 AM.png
 

A look at each company's management team is illuminating. Nearly half of Offerpad's team come from a real estate background, including a co-founder (not pictured) that also co-founded single family rental behemoth Invitation Homes.


Contrast this with Opendoor, where not one single person listed has a real estate background. It appears that all of its executives come from venture-funded technology businesses.

 
Screen Shot 2021-06-06 at 12.42.47 PM.png
 

The end result is two completely different teams with completely different approaches -- one centered in real estate, and the other centered in technology.

Strategic Implications

Offerpad's latest financials strongly suggest that a less venture-funded, less tech-enabled, more real estate focused, and less breakneck version of iBuying can be (almost) profitable.

And while Offerpad is nearly profitable on a small scale, perhaps it also suggests that Opendoor and Zillow can become profitable on a large scale -- not at 4,000, but at 40,000 houses per year -- once sales volumes catch up with overhead expenses.

Finally, the Offerpad story raises questions around the true value of technology in real estate. Like Compass' massive investment in technology (and WeWork before it), Opendoor is over-investing in tech with little to show for it on the bottom line. Technology helps create a great story, but at the end of the day, real estate is still...real estate.

Compete Where You Can Win

In the fast moving world of real estate, it’s never been more important to define a crisp and effective strategy. A portion of my work consists of strategic consulting for a range of real estate tech businesses. That experience has taught me a lot, and I can sum up what I believe to be the single most important concept in strategy: Compete where you can win.

A three minute video of me talking about "Compete Where You Can Win."

Find Your Sustainable Competitive Advantage

All of my strategy work — from multi-billion dollar organizations to scrappy start-ups — starts with a somewhat cliche business school phrase: sustainable competitive advantage. This is what sets a company apart from others; the collection of unique attributes that allow an organization to outperform its competition.

In the world of real estate tech, Zillow has its massive consumer audience, Compass has its deep pockets, Keller Williams has its scale, and Realogy has its brands.

Clearly identifying a sustainable competitive advantage — a company’s strengths — is an important first step in an effective strategy. The critical second step is leveraging that competitive advantage directly against a competitor’s weakness or a market opportunity — competing where it can win.

Case Study: Compass

Perhaps the best case study is Compass. Its competitive advantage was capital ($1.5 billion in VC funding), which it used to gobble up market share.

The competitive weakness that Compass exploited was a traditional brokerage’s inability to compete on capital. Competitors couldn’t match Compass’ commission splits, signing bonuses, or marketing support. Unlike its competitors, Compass didn’t need to worry about being profitable, and the company leaned heavily into this strategy to recruit agents and grow its market share. Compass played a game that it, and it alone, could win.

Compete Where You Can Win

What truly sets yourself or your business apart from others? What can you offer that no one else can, and how can you leverage it against your competitor's weak points? It’s senseless to go up against your competitors where they are strongest (although many still try).

Anyone in real estate, from disruptor to incumbent, behemoth to startup, tech company to individual agent, can effectively compete in today's quickly changing market. It all comes down to being smart about understanding your strengths and competing where you can win.

iBuyer Purchases Recover to Pre-Pandemic Levels

The pandemic of 2020 brought iBuying to a grinding and dramatic halt. The major iBuyers -- Zillow, Opendoor, and Offerpad -- have slowly recovered, with total purchases in Q1 2021 finally rising to the levels of the same period last year.


A few additional observations on the above data:

  • While Opendoor has matched its year-over-year purchase volumes, Q1 2020 was itself an outlier, with significant slowdown in purchases from Q4 2019.

  • On average, Opendoor is still 35 percent below its high-flying 2019 peak.

  • Offerpad, soon to go public via a SPAC, is a respectable third player, with purchase volumes of about half of the leaders.

Before the pandemic, Opendoor was the clear category leader, purchasing over twice as many houses per month as Zillow. The lockdown was the great equalizer; both companies dropped to near zero, and recovered at the same pace throughout 2020. However, in the first quarter of 2021, Opendoor again pulled ahead while Zillow took its foot off the accelerator.


From a sales perspective, all iBuyers are still well-below their pre-pandemic highs. Opendoor sold 55 percent fewer houses in Q1 2021 than the same period a year ago. This is attributable to timing; as the iBuyers purchase more houses and rebuild their inventories, sales will follow.

 
Screen Shot 2021-04-20 at 9.38.16 AM.png
 

Individually, the top six iBuyer markets are mirroring the gradual recovery. Phoenix and Atlanta remain the largest markets by volume by a wide margin.

 
Screen Shot 2021-04-20 at 9.37.54 AM.png
 

The iBuyers are down but not out. Recovery continues at pace; the business model is certainly here to stay, but not without its recovery challenges.

CAC-attack: The Cost of iBuyer Customer Acquisition

Over the past three years, the largest iBuyers -- Opendoor, Zillow, and Offerpad -- have spent over $200 million advertising directly to consumers. That spend peaked in 2019 before slowing during the pandemic. Historically and today, Opendoor appears to be vastly outspending its competition -- a reflection of its size, scale, and ambition.

 
image.png
 

Historically, Opendoor has bought and sold more houses than its iBuyer peers, so it's important to consider the advertising expense per customer, or customer acquisition cost (CAC). Last year appears to be an expensive outlier for Opendoor.

 
image.png
 

Generally, it's what you would expect: between $3k–$4k in a normal year. Given that each iBuyer pays a 1 percent referral fee to agents for a closed lead (or $2,500 on a $250k home), the numbers make sense. It's also a blended average, so mature markets are likely less expensive while new markets are more expensive.

A broad comparison, which includes newly-released data from Offerpad (with a CAC of about $3k), and advertising expenses from Redfin's brokerage business, provides further context around the iBuyer spend.

 
image.png
 

Some interesting observations:

  • Customer acquisition costs for the majors iBuyers is all roughly the same: between $3k–$4k (if we consider 2020 an outlier for Opendoor).

  • Zillow, with its massive audience advantage, has to spend much less on advertising, and has a meaningful CAC advantage.

  • Compared to Redfin's brokerage service (which also has the advantage of an existing portal with millions of visitors), the iBuyers are spending 2x–4x more to acquire each customer. This is not an exact corollary, but is reflective of how difficult it is to convince consumers to try something new.

Shifting Headcount

The Sales & Marketing line for each iBuyer includes headcount expenses for employees involved in the sale of homes, a fairly broad definition. And there was a noteworthy shift in headcount during 2020.

Opendoor laid off staff and saw a "decrease of $26.7 million due to headcount reductions," while Zillow saw an "increase of $21.8 million in headcount-related expenses." Opendoor was trimming its sails while Zillow continued to invest for a future recovery; the advantage of being well-capitalized during 2020.

 
image.png
 

A Note on Methodology

Customer acquisition cost is calculated based on the total advertising spend divided by the number of homes purchased in a period of time. Direct advertising and headcount expenses are taken from each company's public filings, which is straightforward if you know where to look and are willing to do a lot of math.

The Economics of iBuying, 2020 Edition

With 2020 firmly behind us, the world's two largest iBuyers have released their full financial results for the year. Last week, we looked at their total financial losses. And today: A direct financial comparison of Zillow vs. Opendoor, and an individual look at the key points of difference from 2019.

An Overall Financial Picture

A comparison between Zillow and Opendoor highlights the tightening race between the two billion-dollar behemoths. In terms of revenue (which includes the full value of a home), Opendoor has managed to maintain a 50 percent lead over Zillow. But that lead is down from a whopping 250 percent in 2019.

 
68cc80fd-f6ef-46d2-8f45-98d2d71951d7.png
 

Opendoor's 2020 experience was fluid. It managed to improve the efficiency of its business model, as measured by gross margin (driven by home appreciation and ancillary services), while reducing operational costs. This improved its contribution margin, but with robust overhead expenses, its net margin further deteriorated.

 
5bfefabe-5012-4b33-a217-a04cf477ee35.png
 

Zillow continued to grow its iBuyer business in 2020. It saw an increase in revenue and improved gross margins, with relatively static operational costs. It managed to reduce its overall net loss compared to last year.

 
42327a10-fc36-4e8a-b074-270a856f3b41.png
 

The differences between Opendoor and Zillow, from a financial and unit economics perspective, are evident in the numbers:

  • Opendoor is better able to monetize the transaction (higher gross margins).

  • Zillow's Selling Costs are higher (due to the use of partner agents, an activity being phased out in 2021).

  • Opendoor is eking out small efficiency gains in Holding Costs and Interest Expense, an advantage that accumulates at scale.

Or, in other words: Opendoor is more operationally efficient, Zillow is catching up, and both companies remain unprofitable.

Unit Economics

The following charts, which are to the same scale, illustrate the economics above in a more attractive visual fashion. Amongst other things, they highlight how large indirect expenses are in both businesses.

 
Screen Shot 2021-03-12 at 9.08.35 AM.png
 
 
Screen Shot 2021-03-12 at 9.08.37 AM.png
 

While not necessarily hidden, neither company is guilty of highlighting its overall net losses nor the unprofitable nature of the business (a topic I discussed in iBuyers Turning Obfuscation of Profit into an Art Form). There are various forms of financial misdirection at play that highlight unit economics, Adjusted EBITDA, or other metrics that don't convey a complete picture of the business.

The point is not that these business are unprofitable and therefore must be bad. Spending (and losing) money to gain market share is a well-worn path. The point is that these companies are actively doing it, and if you're in the real estate industry, concerning yourself with disruptors willing to lose billions is a good use of time.