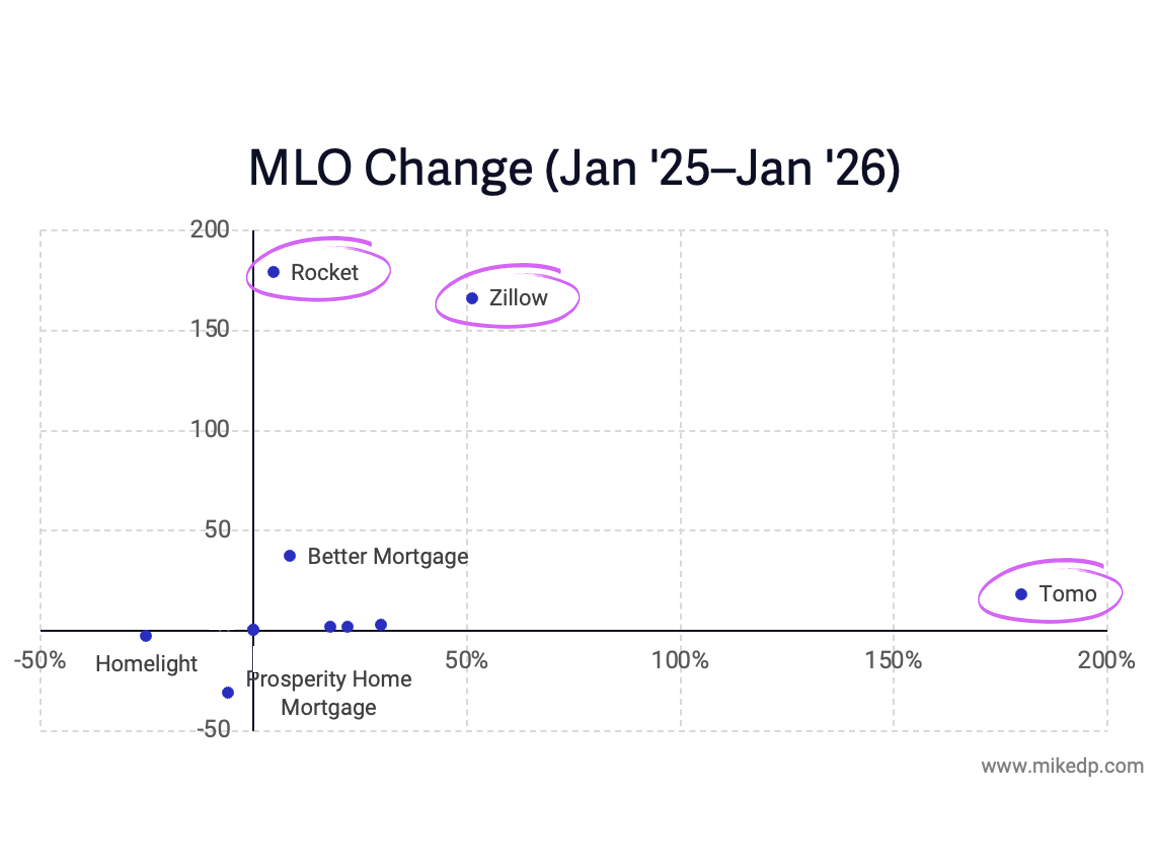
An Analysis Of Pending Sales, A Proxy For Buyer Demand
/Much of my market research has focused on new listings coming to market, a strong proxy and indicator of seller demand. Now I've turned to pending sales -- offers being made and accepted on a home -- as an equally strong proxy for buyer demand.
As expected, the number of pending sales is beginning to rebound in some markets as restrictions ease.
Pending sales -- representing increased buyer demand -- are increasing in a number of cities like Tampa, Chicago, and Seattle. Following a significant dip around the end of March, the number of pending sales has steadily increased throughout April, in the all-too-familiar checkmark shape.

However, not all markets are recovering. Several major East and West Coast metros, including New York City, Philadelphia, San Francisco, and Los Angeles, are still in their lows and have yet to see the number of pending sales recover.

Comparison to Last Year
The analysis above simply looks at the number of pending sales over time. Given the seasonal nature of real estate, a second, important dimension to consider is year-over-year performance: How does 2020 compare to 2019?
An annual comparison shows many markets down between 20-80 percent compared to the same time last year, with some recovering, and others still flat.
Some markets, like Austin, have recovered quickly with pending sales at the same level of last year -- highlighting strong buyer demand. While it is recovering, Seattle is still down a significant 20 percent from last year, with New York and San Francisco still down 60-80 percent from 2019 volumes.


The advantage of plotting data over time is the ability to reveal momentum. Markets like Nashville, Raleigh, and Charlotte are all trending lower; buyer demand is not picking up as quickly as last year. Not all markets are in recovery mode.
Key Takeaways
The data suggests that buyer demand (as represented by pending sales) has been significantly effected by the pandemic. Volumes are down over 35 percent nationally, with some markets down as much as 60-80 percent compared to last year. Buyer demand is beginning to recover in some markets, but not all.
Try it Yourself
I was recently quoted in an article on Curbed: "No matter what narrative you have you can support that story with data. You can find data to support any story you want, whether it’s everything is fine, it’s the end of the world, or something in between.”
My goal with this analysis is to replace uncertainty with data, and to give you the tools to explore the data directly: try it out with my Real Estate Market Tracker.
(It's worth noting that while the data comes from Redfin, it's not perfect. Several markets, including Atlanta, Dallas, and San Antonio were removed from this analysis because of significant data issues. I hope to include them in the future.)