2 Key Learnings from a Purplebricks Retrospective
/
U.K.-based Purplebricks remains one of the best examples in the world of a real estate disruptor going from zero to one.
Why it matters: It’s a complex growth story revealing two key learnings that apply to all real estate tech disruptors: the adoption ceiling and reversion to the mean.
The adoption ceiling is the phenomenon where a disruptor's market share stops growing and plateaus (also called market saturation).
This is common across many new models, but especially prevalent in real estate due to its highly fragmented, non-differentiated nature.
Purplebricks hit its adoption ceiling in 2019; there were only so many early adopters willing to try its substantially new model (pay a lower fixed-fee up front instead of a commission upon sale of a home).
The Covid-19 pandemic and the growth of similar models contributed to an erosion in new listings (called instructions) -- and market share -- beginning in 2020.

Hand-in-hand with a plateauing market share are rising customer acquisition costs (CAC); with scale, it becomes more expensive to acquire each new customer.

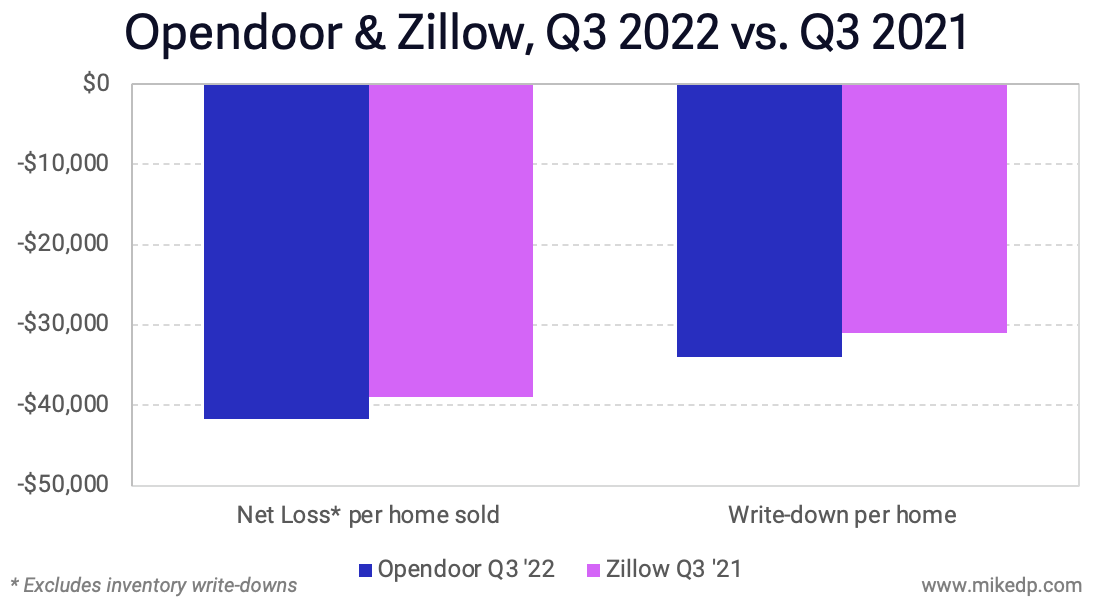
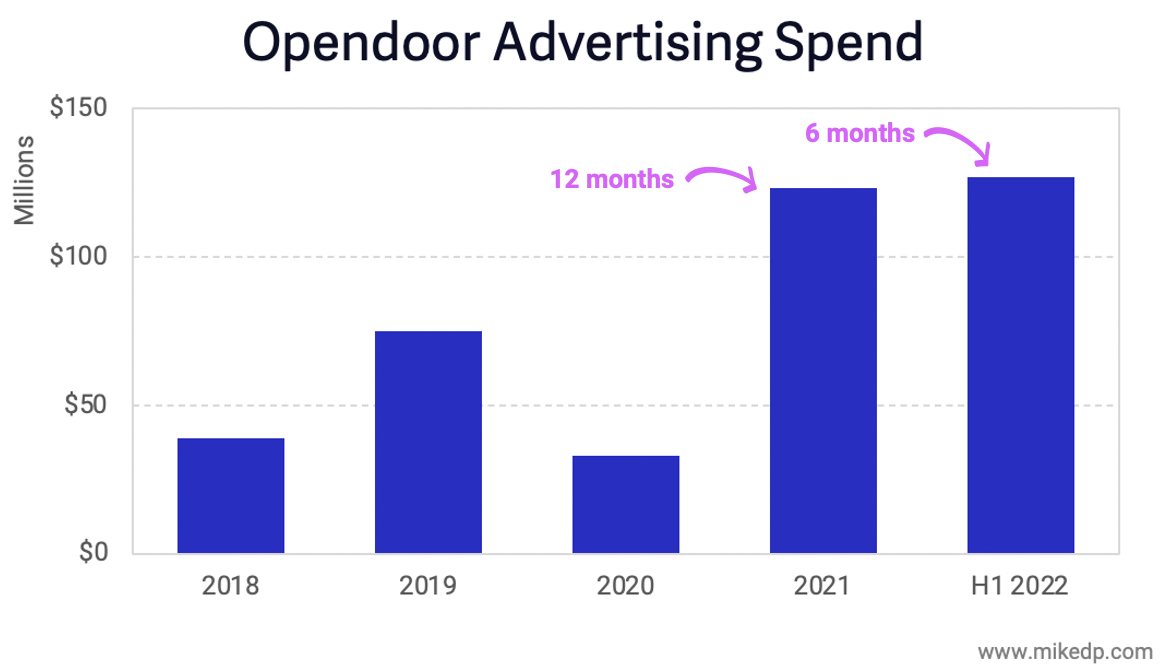
Opendoor, the U.S.-based iBuyer, has experienced the same phenomenon as it scales, with customer acquisition costs substantially higher in 2022 compared to past years.

Reversion to the mean is the tendency of real estate disruptors, over time, to look more and more like the incumbents they are trying to disrupt.
Purplebricks has steadily increased its once-low fees, has adopted a "pay later" option, and made its agents full-time employees -- putting it much closer to the traditional estate agent model.
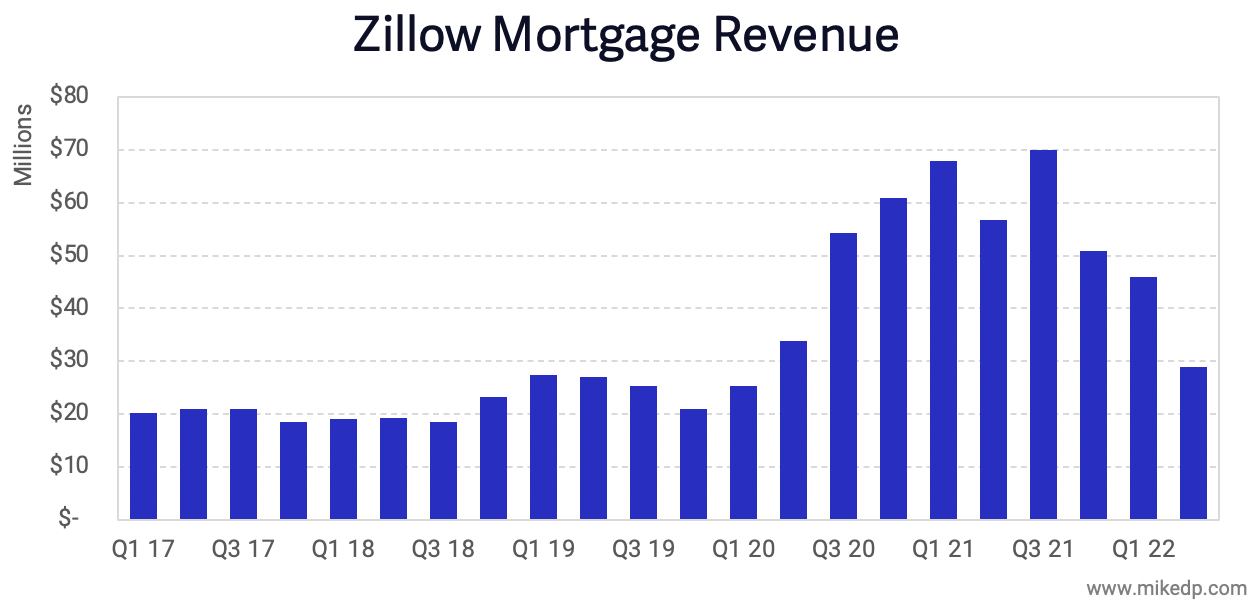
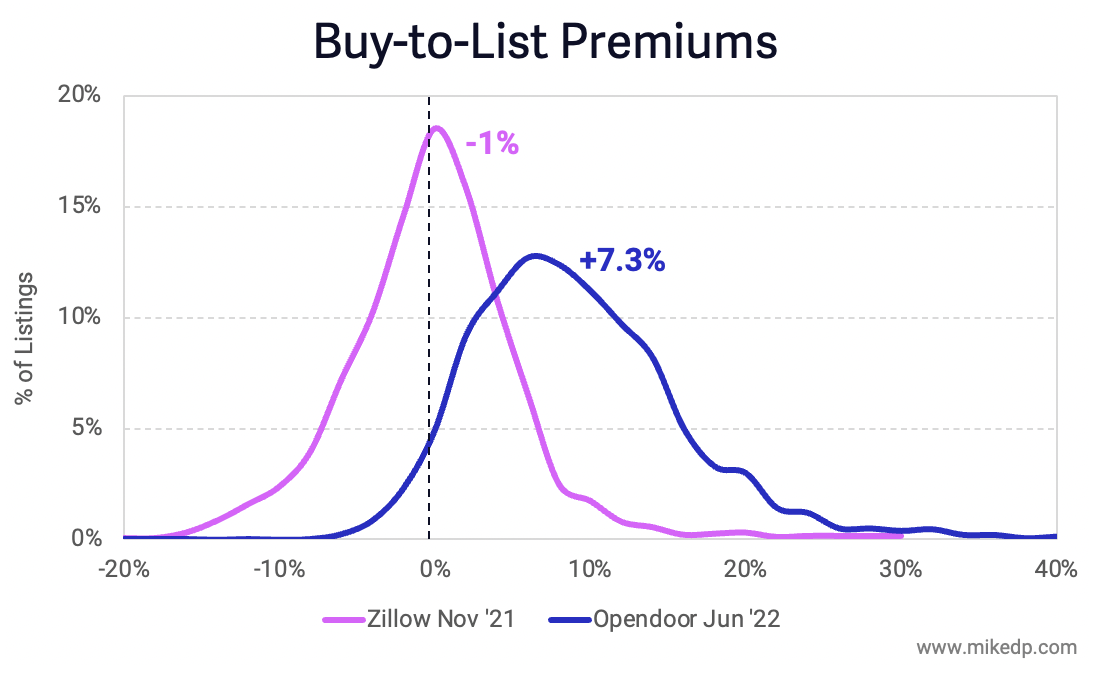
Meanwhile across the industry, iBuyers have launched traditional, agent-led sales options, leading portals have bought traditional mortgage businesses, anti-MLS disruptors have started listing on the MLS, and over time Compass looks less like a tech company and more like a brokerage.


The bottom line: Like so many real estate tech disruptors, Purplebricks is a "cautionary tale" about overreach and setting unrealistic expectations.
Back in 2018, I was quoted in The Financial Times about this exact topic. Not much has changed.
The power -- the gravitational pull -- of the traditional real estate industry is incredibly strong.
Over time, even the most well-funded, aggressive start-ups have a tendency to be assimilated into the traditional industry.