Do Compass and Opendoor Have A WeWork Problem?

On its path to a now-delayed IPO, SoftBank-backed WeWork’s valuation has fallen from $47 billion to somewhere between $10 billion and $15 billion. This precipitous drop appears to be a collective repudiation of not only WeWork’s business model and SoftBank’s valuation philosophy, but of the inverted economics of big money unicorns without a path to profitability.

WeWork’s valuation challenges highlight the potential issues that SoftBank’s other real estate investments—namely Compass and Opendoor—may face in their march towards IPO.

Strong growth, fueled by capital

WeWork shares a number of traits with Compass, a real estate brokerage, and Opendoor, an iBuyer: They all deal in real estate, have raised massive amounts of capital from SoftBank at multibillion dollar valuations, and are growing incredibly fast. All three are unprofitable, pay most of their revenues away as a cost of sale, struggle with their identity as a tech company, and, in the case of Compass, have a profitable, publicly traded rival that is valued far less.

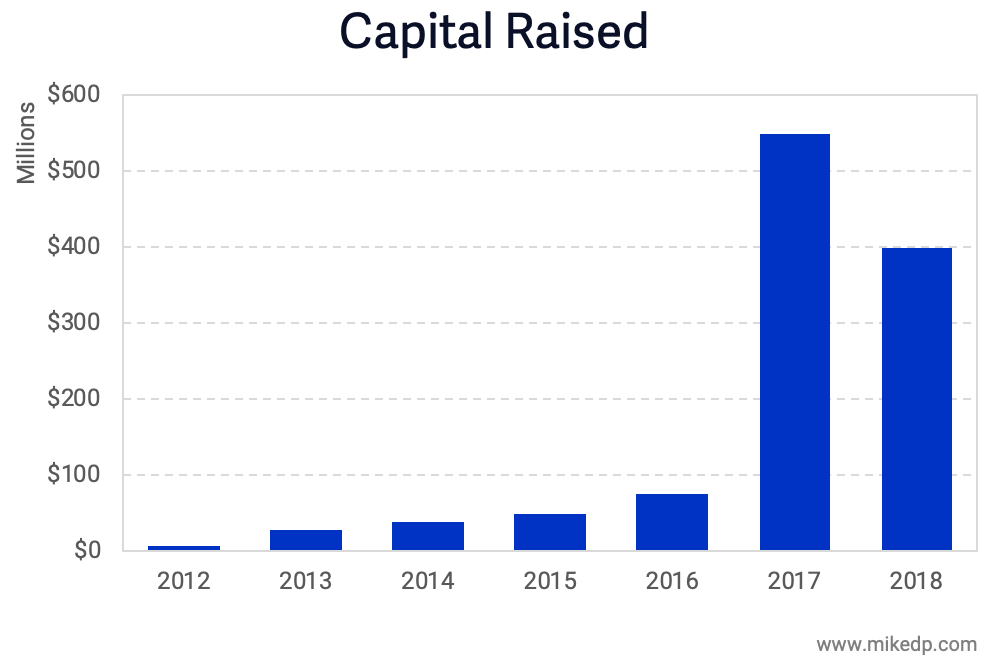
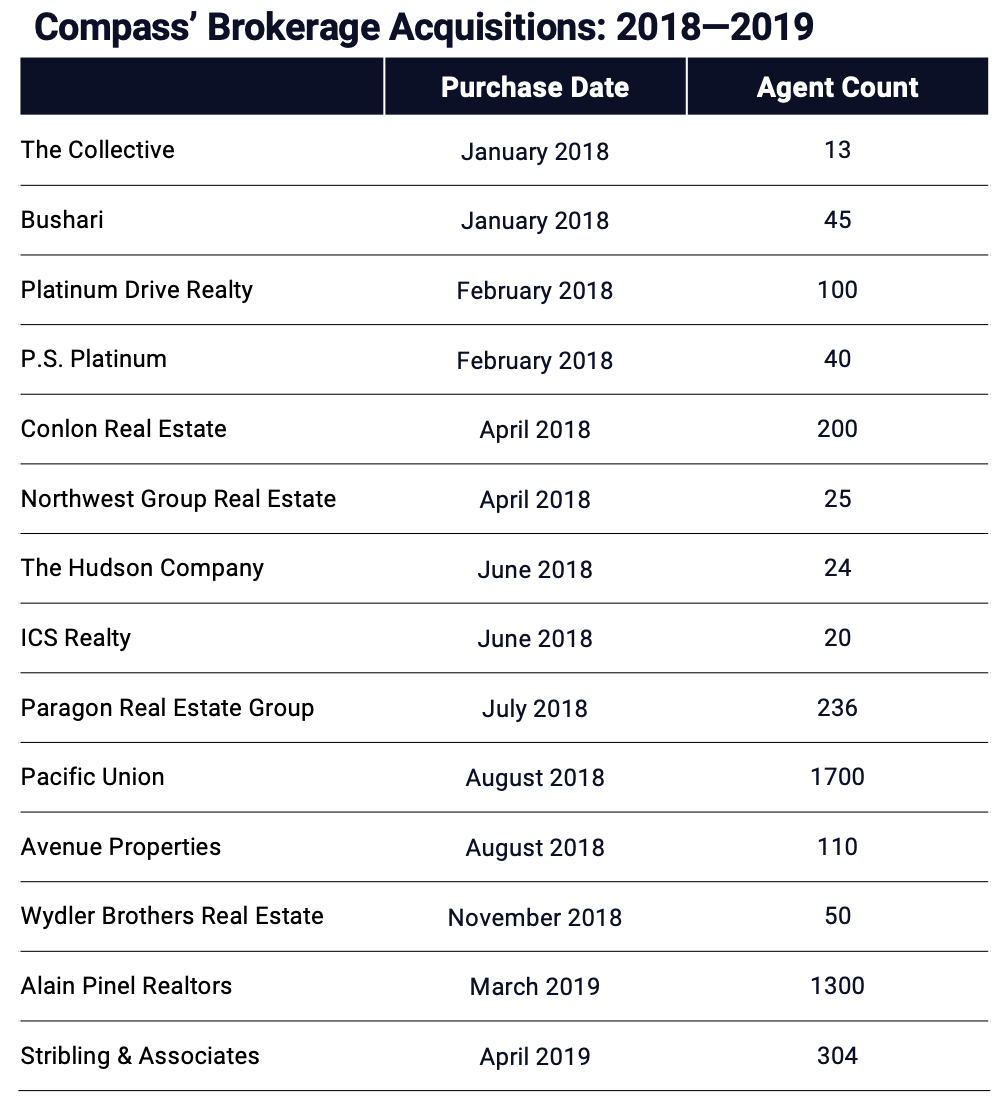
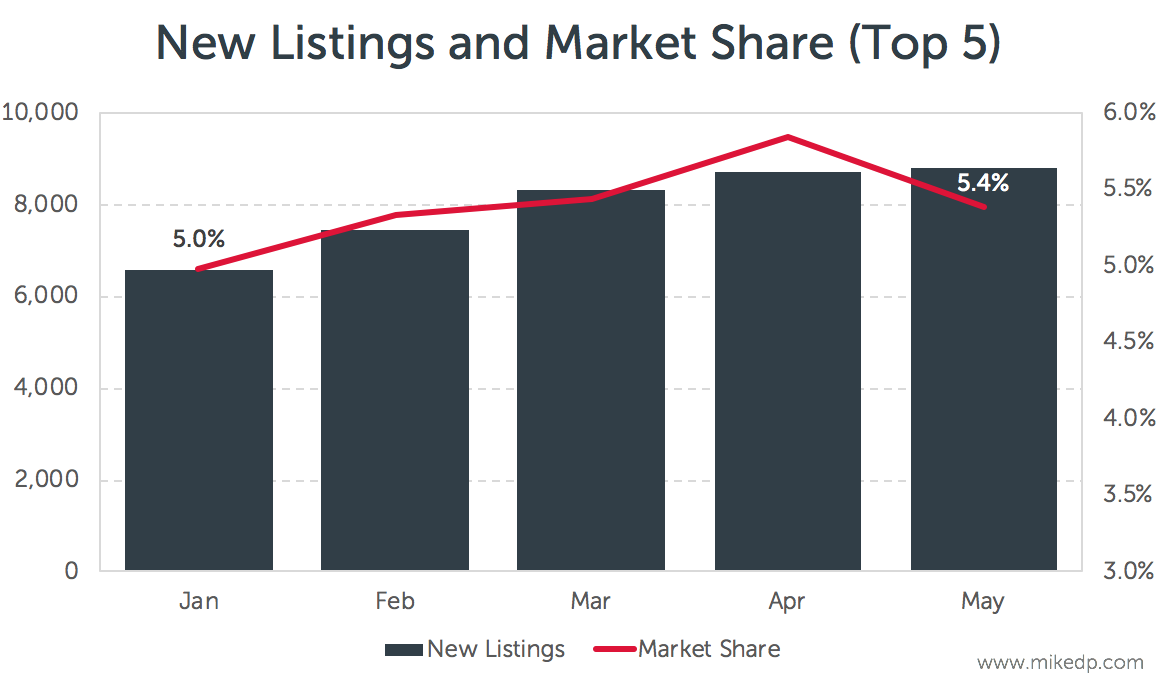
Compass’ business model is fueled by capital. It has raised more than $1.5 billion, which it is using  to acquire brokerages and recruit agents at an unprecedented scale. It is turning dollars into agents, which in turn generate revenue.


Opendoor has raised over $1 billion—more than 10 times its nearest competitor—and has used that capital to fuel a rapid national expansion (in addition to launching a mortgage venture and acquiring a title company). Opendoor is on track to purchase around 17,000 homes in 2019.


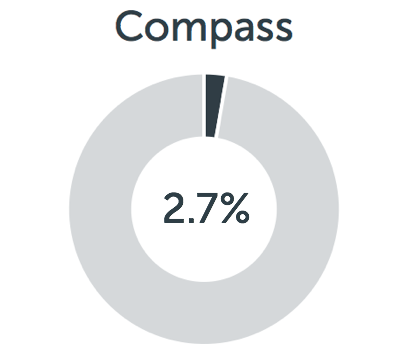
When a company raises such large sums of capital, there is only one possible exit: an IPO. The other path—an acquisition by another company—is priced out of the equation due to the massive valuations involved; other companies can’t afford the transaction. Case in point: Compass’ $6.4 billion valuation is on par with Zillow and nearly four times higher than Redfin.

When selling my company years ago, a trusted advisor told me that a business is worth what someone else is willing to pay for it. SoftBank is certainly guilty of testing the upper bounds of private company valuations, and the WeWork episode makes it clear that what SoftBank is willing to pay for a company is quite different than anyone else.

Justifying a sky-high valuation

Both WeWork and Compass have profitable, publicly traded rivals that are valued far less (IWG for WeWork and Realogy for Compass). In the case of WeWork, “IWG has substantially more square footage and more customers, and has actually made a profit—yet its market cap is just 8% of what SoftBank’s latest funding round thinks WeWork is worth,” according to Recode.

The Wall Street Journal examines why WeWork is struggling to sell its story to investors, and sums up the narrative as follows:

  • WeWork’s revenue is growing fast, but so are its expenses.

  • WeWork’s operating losses are keeping pace with its revenues.

  • WeWork is raising increasingly large sums—but has yet to announce a profit.

  • And a profitable, publicly traded rival is valued at far less.

In 2018 (the last full year where complete information is available), Compass’ publicly traded rival, Realogy, had 42 times the number of transactions, 11 times the sales volume, seven times the revenue—and actually made a profit!—but an enterprise valuation on par with Compass.

WeWork, Compass and Opendoor have valuations that are pegged to their impressive growth rates, but when that growth is dependent on having and spending vast sums of money in an unsustainable manner, it’s difficult to justify.

Impact on Compass and Opendoor

If the pressure from the public markets continues to push for profitability, it may accelerate (or force) a change in the operating economics at Compass and Opendoor, which up until now have fueled their massive growth with massive expenditures.

A drive to increase revenue could lead Opendoor to raise its fees, or Compass to reduce its generous commission splits with agents; either move would severely limit growth. Reducing expenses would come in the form of office consolidation (Compass has over 250 offices across the U.S.), ratcheting down employee perks, or even staff layoffs.

(Uber, another one of SoftBank’s investments, recently announced a round of layoffs from its product and engineering teams: 435 people, or 8%of its entire workforce, were let go. This comes just a few months after Uber, whose stock is down over 20% since IPO, announced that it was cutting 400 employees from its marketing division.)

Stock options

Those most impacted at WeWork, Compass and Opendoor may end up being employees and contractors that have stock options. Compass, in particular, has used this as a key tool for agent recruitment and retention, and a dropping valuation would make those options worth a small fraction of what was initially promised.

In addition to stock options granted to induce agents to join Compass, those agents can also invest a portion of their commissions into the company. As of November 2018, more than 1,000 Compass agents had invested over $20 million into stock options.

And while Compass’ valuation isn’t dropping—it recently increased from $4.4 billion to $6.4 billion—the rate of increase is slowing.


Compass is not WeWork, and nor is Opendoor. But to succeed, all three businesses require an unprecedented amount of capital and a willingness to buy into a vision that is driven more by words than numbers and where the long-term validity of the business model is easier to assert than to prove.

The current WeWork fiasco (and to be clear, we’re talking about a 70% to 80% drop in value simply as a result of opening the books and being honest about the business) shows that valuations can’t keep rising unchecked by the realities of basic economic principles—and that investor patience does have a limit.

After U.S. Flop, Real Estate Brokerage Purplebricks Faces Mounting Headwinds In The U.K.

Tech-driven real estate brokerage Purplebricks released its 2019 results last week. After a failed U.S. expansion, the core U.K. business is still growing and remains profitable, but is facing headwinds in a soft property market. The results highlight the critical importance of scale and customer acquisition costs, and offer a reminder that tech-enabled platforms continue to command a rising percentage of the real estate transaction.

Profitable, but mounting headwinds

Purplebricks’ impressive growth in the U.K. market continues, albeit at a slowing pace. Overall instructions (or instructions to list) are up again, but only 9% compared to the previous year.


At this scale, the trend is unsurprising. As I said last year in this Financial Times article, “Real estate is very fragmented, there are relatively low barriers to entry to get into the business of selling houses, the products are undifferentiated and there’s no customer loyalty. That leads to natural fragmentation.”

Meanwhile, Purplebricks’ finances for the U.K. operation -- while up for the entire year -- have taken a hit in the most recent six months (December to April, 2019).


The decline is driven by a drop in revenue. Compared to the first six months of Purplebricks’ financial year, marketing expenses remained steady while revenue dropped £6.5 million. With a soft property market in the U.K., at least partially driven by the uncertainty around Brexit, it is becoming more difficult and expensive for Purplebricks to acquire customers.

For the first time in its history, Purplebricks customer acquisition cost (or cost per instruction) has increased from the previous year. The trend of increased economics of scale has taken a pause -- perhaps temporary, perhaps not.


Overall marketing ROI (defined as how much revenue each £ in marketing buys) -- while still nicely positive -- is down in the most recent six months.


A financial bloodbath in new markets

Purplebricks announced its departure from the Australian and U.S. markets earlier this year. At the time, international expansion was a key driver in Purplebricks’ stock price and investor optimism. But the latest results reveal what a financial bloodbath the moves were.

In 2019, Purplebricks lost nearly £19 million in Australia and £34 million in the U.S. A large part of this expenditure was expensive marketing. The reasons for the failure in international markets are complex, and range from not picking the right markets to ineffective marketing.

Gross margins and the platform play

A key highlight in Purplebricks’ results are a reminder of the market power it possesses, and more specifically, its high gross margins. A company’s gross margin is the amount of revenue it retains after paying its cost of sales, which for Purplebricks, are payments to its local property experts (aka agents).

In the U.S., average brokerage gross margins are around 15%. The outliers are Redfin and Purplebricks, whose novel operating models enable a standardized process with corresponding efficiency and economic gains for the company.


Purplebricks’ gross margins in the U.K. increased to 63%, up from 58% in the previous year. In other words, for each £899 listing, the agent keeps around $333 while Purplebricks retains £566 of the fee.

And in the U.S., Realtor.com’s $210 million acquisition of Opcity and Zillow’s new flex pricing product follow the trend, with both charging real estate agents around a 30% referral fee when a transaction closes. These are all examples of the core economics of real estate changing, with technology platforms commanding a higher percentage of the transaction.

Purplebricks’ continued -- albeit slowing -- growth in the U.K. highlights the importance of customer acquisition costs in the new world of hybrid and online brokers. Having fantastic technology and a great team will only get you so far; at the end of the day, massive advertising expenditures are required to reach scale, and then, profitability.

Is Compass no longer valued as a technology company?

A few weeks ago, Compass announced its latest funding round: $370 million at a $6.4 billion valuation, bringing its total funding to over $1.5 billion. This provides new answers to a familiar question: Is Compass being valued as a tech company or a traditional brokerage?

Turning dollars into agents

The chart below shows Compass' recent funding rounds and its growing agent count. As I said during my recent Inman Connect presentation, "Compass is turning dollars into agents."

 
Screen Shot 2019-08-16 at 2.12.29 PM.png
 

During Compass' recent funding announcement, it stated that revenue is 250 percent in the second quarter compared to Q2 2018 (or up 150 percent). The highlighted columns represent those two time periods. Compass' agent count in August 2018 was around 4,500, compared to 13,000 in August of 2019. Overall agent count is up 190 percent while revenue is up 150 percent.

Using that growth figure for the full year, which is generous but fair, Compass' 2019 revenue would be around $2.25 billion. A $6.4 billion valuation would imply a revenue multiple of 2.8x -- a significant drop from previous years. While agent count is up 190 percent and revenue is up 150 percent, valuation is up only 45 percent.


Tech company or brokerage valuation

One of the key questions I explored in my deep dive analysis of Compass is whether it is being valued as a technology company or a brokerage. At the time, it was clearly being valued as a technology company, with a revenue multiple of 4.9x -- well above traditional brokerages and much closer aligned to Zillow.


The updated chart below shows revenue multiples based on projected 2019 revenues and stock prices as of July 1, 2019. Zillow still leads the pack, while Compass is on the leading edge of the next rung of traditional and tech-enabled brokerages. On a revenue multiple basis — and compared to 2018 — Compass is being valued less as a technology company and more as a traditional or tech-enabled brokerage.

 
Screen Shot 2019-08-28 at 9.46.30 AM.png
 

(Revenue multiples are just one way to benchmark company valuations. Even using other methods, such as a gross margin multiple, the story is the same: When using the same valuation methodology, Compass' valuation multiple is significantly lower than it was last year.)

Slowing growth?

Revenue multiples are generally based on future growth rates. One could argue that as Compass gets larger and its growth rate slows, its revenue multiple will naturally fall. However, Compass' growth in 2019 appears to be the same as it was in 2018: 150 percent. Compass' lower revenue multiple does not appear to be tied to a slowing growth rate.


Compass continues its impressive growth. Topping $2 billion in revenue would be quite an achievement, and its $6.4 billion valuation is massive. However, as the company approaches an IPO, it's worth noting the lower valuation multiple.

It would appear that investors are less bullish on the company. Either Compass' growth is expected to slow dramatically in future years, or the company is being valued more as a traditional brokerage and less as a high-flying technology company.


Check out my epic, five-part Compass analysis into an easy to read whitepaper. Now you can read all 35 pages in one document, print it out, and easily share with colleagues. Download the free PDF and enjoy!

Inside Compass — Part 5: Endgame

A big hairy audacious goal (BHAG) is a phrase, coined by author Jim Collins in his book Built to Last, meant to convey a company’s visionary “moonshot” goal, often bordering on the unachievable. Think of SpaceX’s aim to make humanity multiplanetary or Google’s goal of organizing the world’s information. These are BIG goals and exponential ideas, without a hint of incrementalism. And big ideas have a tendency to attract big investment.

In real estate, optimizing the commission split and generating revenue by selling mortgages are what brokerages have been doing for years. Going down that path is an old, incremental game plan, which is why it’s unlikely to be Compass’ destination. Investors didn’t pump over $1 billion of venture capital into Compass to build “just another brokerage.”

Compass clearly has big ideas and big goals. But what exactly is its big hairy audacious goal?

More than a brokerage

To justify its massive valuation and satisfy its investors, Compass must become more than a brokerage. Having raised over $1.1 billion at a hefty $4.4 billion valuation, Compass is already richly valued as a tech company rather than a traditional real estate brokerage.

 
Screen+Shot+2019-05-13+at+12.42.04+PM.png
 

When a company raises venture capital, especially at the scale Compass has, investors expect a significant return on their investment. When SoftBank invested in Uber in 2018, it was valued at $48 billion with expectations of a $100 billion IPO (as of June 2019, Uber is worth around $75 billion).

As a late-stage, private company almost certainly heading towards an IPO, investors likely have similar expectations for Compass — call it a $10 billion valuation at IPO. Compass can’t justify this valuation as a traditional real estate brokerage. Incremental improvements are not in the cards; to achieve a meaningful outcome for owners and investors, Compass needs to embrace more radical changes to its business model, and real estate in general.

Changing the game

As we’ve seen in my previous analysis, Compass’ economics are similar to a typical brokerage. The primary revenue and expense drivers are the same: revenue generated as a percentage of the commission from real estate agents, and expenses driven by employee costs, office space, administration and technology.

To date, the models that have meaningfully shifted core brokerage economics at scale have all featured novel operating models. Redfin, with full-time, salaried agents, and Purplebricks, with a fixed-fee independent contractor network — both backed by significant lead capture and centralized support organizations — have demonstrated exponential efficiency gains.


From an economic standpoint, the efficiency gains pay off for the brokerage. Redfin operates at a gross margin of 24 percent (about double Compass), while Purplebricks U.K. enjoys gross margins over 50 percent.

 
compass: estimate, Industry average: real trends industry benchmark, redfin: fy2018, purplebricks: fy19 (U.k. only)

compass: estimate, Industry average: real trends industry benchmark, redfin: fy2018, purplebricks: fy19 (U.k. only)


Because of their novel operating models, Redfin and Purplebricks have a great deal of direct control over their agents, allowing them to standardize processes to deliver a more uniform and efficient consumer experience.

For Compass to break out of the traditional brokerage mold and fully realize its ambitions, it needs to become more than a brokerage, and more than a technology company. It needs to become a platform. And in doing so, radically change brokerage economics and, consequentially, the role of agents.

The platform play

To become a true real estate platform, Compass first needs to become a consumer destination.

Redfin has its portal, Uber has its app, and Purplebricks (in the U.K.) has its web site. In each case, consumers go directly to the company — not an agent or driver — to start their journey, giving the platform owner unprecedented ecosystem power. The platform owner controls the lead, distributes it, and takes a healthy cut of the revenue. If an employee or contractor doesn’t perform to expectations, the company removes them. The platform owner is in complete control.

For Compass to become a consumer destination, it needs eyeballs. The most effective strategy — and likely the only possible strategy given the market dominance of Zillow — is to build consumer traffic with the draw of exclusive listings. It’s a similar strategy to Netflix and Amazon’s exclusive video content. If the Compass web portal advertises houses for sale that aren’t available anywhere else, it draws consumers to the platform.

Building exclusive content

The secret to building audience with exclusive content is scale: Compass needs significant market share for this strategy to work. Pocket listings, which are withheld from the MLS for a period of time, have been around for years, but never employed at this scale. Compass needs to advertise so much exclusive content, including coming soon listings, that consumers can’t afford to miss it.

The evidence that Compass is strongly promoting exclusive content is plainly visible on its web site. In fact, exclusive content is the primary call-to-action on Compass’ web site, starting with top billing on its site navigation.

Scrolling down the page, the first content after the search box is a section highlighting exclusive listings before they hit the market.


A few Google searches for homes for sale in San Francisco yields the following results. Not only is Compass paying top dollar for its position, but notice who it is competing and bidding against.

Compass is expending a considerable amount of resources to attract consumer eyeballs to its web site. In addition to the above, it has search engine optimized pages for exclusive properties in each market. This focus on exclusive listings currently sets Compass apart from Zillow, Redfin, Purplebricks, and most other traditional brokerages — no other company gives it this much focus (or any focus at all).

The result is a high proportion of listings that are exclusive to Compass (which includes coming soon). As of June 2019, anywhere from 12 to 27 percent of Compass listings in a market are exclusively listed on the Compass web site — a significantly high number. Across six markets, that represents over 1,800 listings, none of which are advertised on the MLS or any other portals, including Zillow.

 
Screen Shot 2019-06-26 at 4.38.22 PM.png
 

Compass is encouraging agents and consumers to list properties as Coming Soon as an effective pre-sales tool. This agent team page touts specific benefits, such as fewer days on market and more visitors at the first open home, while this agent team highlights the benefits of increased exposure and pre-listing feedback.

Flexing its platform power

Once Compass has consumer eyeballs, what’s next? The same thing that Zillow, Redfin, and Purplebricks do: generate and control the distribution of leads to agents.

Recently we have seen more power being accrued in real estate platforms that distribute leads. Realtor.com’s $210 million acquisition of Opcity and Zillow’s new flex pricing product both charge real estate agents around a 30 percent referral fee when a transaction closes. Over time, the amount charged for a lead has consistently gone up.

Redfin and Purplebricks also control the flow of leads. Redfin distributes its leads to salaried agents, while Purplebricks pays its local property experts in the U.K. around 25 percent of a fixed listing fee. Both companies control the flow and distribution of leads to their agents, which is a necessary ingredient for a platform to fundamentally change the economics of a traditional real estate brokerage.

Endgame

It would be naive to think Compass has raised over $1.1 billion in venture capital to become just another real estate brokerage. Even adding adjacent services like mortgage doesn’t change the core economics of the broker model — bigger changes are required to justify its valuation. Compass has larger ambitions, and it’s likely that its big hairy audacious goal is to become a real estate platform. The evidence suggests the following strategy:

  • Build market share (listings) through aggressive agent recruitment and acquisition.

  • Once market share is high enough, encourage sellers to list exclusively on Compass for a period of time.

  • Leverage exclusive content to drive consumers to the Compass portal.

  • Launch a Compass platform that generates and distributes leads to agents.

  • With platform power, transition the role of an agent (Redfin/Purplebricks/Uber), taking a larger cut.

Compass is a real estate disruptor on a scale never before seen in the U.S. With deep pockets and big ambitions, its impact on the real estate industry is only just being felt. Compass, its investors, and a number of well-funded peers are aiming for massive change in an industry that has resisted massive change for years. Whether its strategy succeeds or fails, the die is cast and the race is on.


Inside Compass: A Strategic Analysis

My epic, five-part Compass analysis in one easy to read whitepaper. Download the free PDF and enjoy!

Inside Compass — Part 4: Sustainability

Part One of this series took a detailed look at Compass’ growth strategies, while Part Two examined if Compass is a tech company, or a traditional brokerage, and Part Three looked at Compass’ $4.4 billion valuation compared to its industry peers.

Part Four of this series looks at sustainability. Can Compass keep up its aggressive — and expensive — acquisition strategy? Will agents, without whom Compass wouldn’t generate any revenue, remain happy and stay under the Compass banner? And perhaps most importantly, can the company generate a profit?

The search for profitability

Compass is not profitable. Given its massive expenditures — both to support its brokerage acquisitions and to support its growing employee base — there’s simply no way it can be making money. Nor should it be (yet).

Compass is a growth stage business, investing today for a more powerful and profitable tomorrow. The question for all growth-stage businesses is whether they can ever achieve profitability. A number of other real estate industry behemoths are also unprofitable on a GAAP basis: Zillow, Redfin, Opendoor, eXp Realty, and Purplebricks.

Compass, like all private companies, does not need to share its financials. But with the data is does make public, in addition to benchmarks against public company peers and a few educated assumptions, we can paint a rough picture of its financials. To refine my thinking for this analysis I’ve spoken to dozens of industry executives and insiders, including leaders of top brokerages, independent analysts, and current and former Compass employees and agents.

Revenue and gross margins

Compass ended 2018 with around $900 million in revenue (source: Robert Reffkin’s letter on Inman). Like its real estate brokerage peers, eXp Realty and Realogy, that number includes the full real estate commission, only a fraction of which Compass retains. A large percentage of that number is paid directly to agents (70%–90%), with a smaller percentage retained by Compass as its gross profit. This is the commission split.

According to REAL Trends, which has been tracking the residential brokerage industry for decades, the average retained revenue (gross profit) of brokerages was 14.9 percent in 2018. The sample size is 200–300 of the largest U.S. brokerages.

 
Screen Shot 2019-06-08 at 7.04.58 AM.png
 

High producing agents typically command more favorable commission splits as high as 90/10 — with only 10 percent retained by the brokerage. There is anecdotal evidence (including a number of agents I’ve spoken to, agents that Compass attempted to recruit, and brokers that have lost agents to Compass) that in some cases Compass offers 100 percent commission splits as a recruiting incentive, either for a certain amount of time or a fixed number of deals.

This is confirmed by the Wall Street Journal, which reports, “The firm has lured top talent with some of the most generous commission splits in the business: Some agents received all the sales commission, with nothing going to Compass, on as many as eight of their first deals, according to offer letters.”

eXp Realty, another self-proclaimed tech-enabled brokerage with revenues of $500 million in 2018, has 8 percent gross margins. eXp Realty also offers favorable commission splits with a cap on fees, and is the best benchmark available for Compass. It’s likely that Compass’ gross margin is in the 10–12 percent range, and for this analysis I’ve assumed 12 percent, resulting in $108 million of gross profit in 2018.

Operating expenses

Estimating Compass’ operating expenses is more complicated. I’ve used three different methodologies in order to provide a range of data points:

  • Operating expenses as a percentage of revenue

  • Operating expenses as a percentage of gross profit

  • Build-up approach

(Readers are encouraged to download the companion Excel file and plug in their own assumptions. It’s a choose your own profitability adventure!)

Compass has four publicly listed peers with similar business models: Realogy, eXp Realty, Redfin, and Purplebricks. Each company reports and breaks out operating expenses into various categories, including technology, marketing, and general and administrative. It’s straightforward to calculate each company’s operating expenses as a percentage of overall revenue, and as a percentage of gross profit.

 
Screen Shot 2019-05-31 at 10.01.09 AM.png
 

On average, the four industry peers’ operating expenses are 32 percent of revenue and 113 percent of gross profit (Redfin and eXp Realty are unprofitable). Applying those same averages to Compass suggests operating expenses of between $122 million and $288 million in 2018.


The build-up approach for operating expenses focuses on known data: employee headcount and office expenses. Based on the same source of information, here’s what is known:

  • Compass had 238 offices at the end of 2018

  • Compass had around 1,500 employees at the end of 2018

Compass operates in expensive metro markets like New York City, San Francisco, and Seattle, so employee costs are on the high end of the spectrum. According to a review of 250 employees on Glassdoor, the average salary for a Compass employee is $72,000 per year (ranging from $60k for an office administrator to $120k for a software engineer).

 
Screen Shot 2019-06-06 at 7.54.05 PM.png
 

That figure doesn’t include benefits; according to the U.S. Department of Labor, on average, employee benefit costs account for around 30 percent of total employee costs. That would put total employee costs at $100,000 per head (salary plus benefits), resulting in an annual staff cost of $150 million for Compass’ 1,500 employees.

For office space, several industry insiders and CEOs of top brokerages claim that 75–100 square feet of office space per agent is a reasonable benchmark. Cushman & Wakefield reports that the national average, across all industries, is 194 square feet per employee. I’ve assumed an average of 83 square feet per agent, or 3,500 square feet for each of Compass’ 238 offices.

Compass pays from the mid-$60s to mid-$70s to $80 per square foot for some of its NYC offices, and $54 per square foot for a San Diego office. I’ve assumed an all-up expense of $60 per square foot, resulting in a total annual rent cost of $50 million.

 
Screen Shot 2019-06-06 at 7.34.55 PM.png
 

Employee and office space expense alone totals $200 million. This figure doesn’t include a number of other one-time and ongoing expenses, such as sales and marketing and office fit-outs, which would push that number even higher.

This figure is Compass’ expense run-rate, based on figures from the end of 2018, a year which Compass grew its employee count and office space incredibly fast. Taking a mid-point average (150 offices and 1,000 employees) yields an employee plus office cost expense of $132 million for 2018.

(Based on this June 12, 2019 update from Compass, there are currently 2,500 employees. Assuming 248 offices, the current employee plus office expense run-rate is $300 million per year (not including other operating expenses), up from the $200 million mentioned above.)

Based on rough industry benchmarks, Compass’ operating expenses could range anywhere between $122 million and $288 million in 2018 (quite a range). But the build-up methodology suggests it was closer to $150—$200 million.


Operating expenses of between $150 million and $200 million in 2018 are nearly double Compass’ gross profit. In other words, Compass would be spending between $1.50 and $2 for every $1 in gross profit — not including its brokerage acquisition costs (which I previously estimated to be between $220 and $240 million, paid in a combination of cash and stock).

 
Screen Shot 2019-06-06 at 7.39.17 PM.png
 

Profitability Catch 22

In its march towards long-term, sustainable profitability, Compass faces a dilemma. Like other brokerages, its gross profit is directly tied to the commission splits it offers agents. Profitability is a Catch 22: reducing commission splits for agents increases gross profit for Compass, but makes the company a less appealing home for agents.

Compass must look elsewhere for new sources of revenue — but it’s unclear where.

Compass’ chief operating officer told the Wall Street Journal, “We’re not yet at a stage where I have a very clear monetization strategy because we haven’t really talked about it.” Its CEO said the company plans to make money through ancillary services like title, mortgage and insurance services, but it’s not clear how. “Short term profitability is something that many of the more modern companies are not as focused on,” he added.

To grow revenues, Compass needs more agents closing more deals, and — unless something radically changes — those agents will require more, not less, support staff and office space. To reduce expenses, Compass would need to trim its full-time headcount or slow the hiring of support staff, or consolidate and close a number of its offices — both of which run the risk of making Compass a less attractive brokerage partner for agents.

The options available to Compass — optimizing the commission split and generating revenue by selling mortgages — are the same available to other real estate brokerages, and in fact, what they have been doing for years. Going down that path is an old game plan, which is why it’s unlikely to be Compass’ destination. Investors didn’t pump over $1 billion of venture capital into Compass to build “just another brokerage.”

Endgame

This analysis presents a thorough look at what Compass is doing; the alluring, unanswered question is why.

The company is deploying an aggressive acquisition strategy to acquire agents and brokers to build market share, is positioning itself as a tech company, and sports a sky-high valuation based on its growth rate and future plans — but what are its future plans? How does it plan to turn the existing, unprofitable brokerage business into a mammoth of the real estate industry? This is the topic of the next and final installment of this analysis: Endgame.

Inside Compass — Part 3: Valuation

Part One of this series took a detailed look at Compass’ growth strategies, while Part Two examined if Compass is a tech company, or a traditional brokerage. Irrespective of the answer, Compass unquestionably needs to be a technology company — both to support its massive valuation, and to be a sustainable business. Is Compass worth $4.4 billion, and is it being valued as a traditional brokerage, or a technology company?

Valuation overview

Compass has raised over $1.1 billion in venture capital, starting with $8 million back in 2012. Its latest $400 million round in September 2018 valued the company at $4.4 billion, up from $2.2 billion in December of 2017. Compass’ rising valuation is matched by its impressively growing revenue.


Compass’ peers in the real estate technology space, both public and private, feature an exciting range of valuations. In general, technology companies like Zillow, Redfin, and Opendoor have higher valuations, while traditional brokerages like Realogy and RE/MAX have lower valuations. Investors clearly favor technology companies.

 
source: public markets, april 2019. Private companies at time of last funding round.

source: public markets, april 2019. Private companies at time of last funding round.


(Both Realogy and Purplebricks have recently released news and earnings results that resulted in a significant drop in valuation. I’ve used numbers from April in an effort to provide a more fair, “moving average” valuation.)

Revenue multiples

One way to determine a company’s value is by using a revenue multiple. That multiple — say 1x or 2x — is multiplied by current revenues to establish a valuation. The higher the multiple, the more optimistic investors are about future growth prospects, and the more that company is worth.

Compass sports a relatively high revenue multiple — rivaled only by tech company Zillow. While its business model is most similar to peers like Redfin, RE/MAX, eXp Realty and Realogy, investors are significantly more optimistic about Compass’ future prospects.

 
based on last full year financials (2018 for most companies).

based on last full year financials (2018 for most companies).


Growth rates significantly factor into a company’s valuation; investors are generally more optimistic the faster a business is growing. This cohort of real estate tech businesses are growing revenues at vastly different rates.

 
Screen Shot 2019-05-13 at 8.53.18 AM.png
 

However, a high revenue growth rate does not necessarily correlate to a high revenue multiple, as evidenced by the following chart. Of the fastest growing companies — Compass, eXp Realty, and Opendoor — Compass boasts the highest revenue multiple, more similar to Zillow and Redfin. (Bubble size denotes overall valuation.)

 
Screen Shot 2019-05-13 at 12.51.25 PM.png
 

Over the past three years, Compass’ valuation has been closely tied to its revenue, which is growing exponentially. As discussed in Part One of this series, that growth has come from an aggressive acquisition strategy. The revenue multiple for each of Compass’ recent capital raises has remained consistent: 5x—6x. Investor sentiment has remained consistently optimistic.

 
Screen Shot 2019-05-13 at 8.58.05 AM.png
 

Transaction volumes

Another metric to consider when valuing companies — especially real estate tech companies that are involved in the transaction — is transaction volume. A number of the biggest companies in real estate, including those discussed here, are newly obsessed with building end-to-end transaction platforms. And an important part of that platform strategy is offering ancillary services such as mortgage and title.

Another angle is the predictive and educational power of data. Whether it’s Zillow, Redfin, Compass, or Keller Williams, all are talking about the power of data in their end-to-end platforms. Many companies consider it a potential competitive advantage, and are making heavy investments to build out enhanced data capabilities.

To fully realize its value, a platform needs to be used. The upsell opportunity around ancillary services and the predictive power of data all require transactions flowing through the platform, and the more the better. Similar to the benefits of network effects, more activity on a platform makes it more valuable. Thus, the more transactions a brokerage facilitates, the stronger position it should have in the overall ecosystem.

A transaction volume metric for company valuations is not typically used nor talked about in the industry. The number of transactions each company conducts, and the number of consumers they touch, again varies wildly.

 
SOURCE: SWANEPOEL MEGA 1000

SOURCE: SWANEPOEL MEGA 1000


Despite so much potential future value being attributed to ecosystems that touch consumers and facilitate transactions, it does not correlate to company value. In fact, it is exactly the opposite. The following chart shows company valuations divided by transaction volumes — or the “value per transaction.”

 
Screen Shot 2019-05-13 at 10.00.13 AM.png
 

Even though Realogy and RE/MAX have, by far, the most transactions flowing through their systems, investors are ascribing very little value to them.

Agent count

Part One of this analysis looked at how much Compass was paying for its brokerage acquisitions. Since the start of 2018, Compass’ agent count has increased from roughly 2,000 to 10,000. Of those 8,000 new agents, around 4,200 came from acquired brokerages. Assuming a total of $230 million spent to acquire fourteen brokerages with 4,200 agents, that’s a cost (or value) of $55,000 per agent.

When Compass raised its latest round in September 2018, it was valued at $4.4 billion, and at the time, had around 10,000 agents. Using the same methodology, each of Compass’ agents was worth — or valued — at $440,000.

 
Screen Shot 2019-05-13 at 2.07.07 PM.png
 

If brokerage valuations were driven entirely by the number of agents — which, incidentally, are the primary revenue drivers — investors are valuing Compass agents eight times higher than what Compass itself is paying other brokerages through acquisition.

What about profit?

There’s one word missing from this analysis so far: profit. What role does the ability of a company to operate profitably play in its valuation? Not much.

Out of the companies mentioned in this analysis — Compass, Zillow, Redfin, RE/MAX, Opendoor, eXp Realty, Purplebricks, and Realogy — collectively worth over $20 billion — only two are profitable: RE/MAX and Realogy. Realogy, the company with the absolute lowest revenue multiple of 0.2x, is profitable. Together, RE/MAX and Realogy are worth $2 billion, less than half that of Compass. Clearly, the potential of future profits trumps the certainty of current profits for investors.

 
profit = net income, not “adjusted ebitda”

profit = net income, not “adjusted ebitda”


Peer valuation scenarios

What would Compass be worth if it were valued like some of its peers (using their revenue multiples)? It’s already at the high end of the range for those with similar business models: RE/MAX, Purplebricks, Realogy, eXp Realty, and Redfin.

 
Screen Shot 2019-05-13 at 1.57.03 PM.png
 

Compass is valued far and ahead of its peers, even those in the same class of technology-enabled brokerage. If it were valued similarly to Redfin, which is a public company, it would be worth $3.5 billion — a $900 million discount to its current valuation. Clearly investors see something more in the company.

If Compass were valued at Realogy’s revenue multiple, it would only be worth $200 million — over 20 times less than its current valuation! Remember: Realogy is profitable, sees over 40 times the transaction volume and has over 6x the revenue of Compass. This stat alone highlights the massive opportunity investors see for Compass, contrasted starkly with the bleak future forecast at Realogy.

A sustainable model?

Investors clearly see something more in Compass — something that massively sets it apart from its peers. Its valuation is being driven by a combination of massive growth fueled by an aggressive acquisition strategy, and the promise of a tech-powered platform to give it a competitive advantage over peers.

It’s fair to say Compass is being valued as a tech company. In fact, Compass is being valued more optimistically than any other traditional or tech-enabled brokerage by a wide margin; it’s valuation more closely matches Zillow, a tech company with a completely different business model.

Having raised over $1.1 billion, Compass is unequivocally causing a revolution in the traditional real estate industry. But how sustainable is its model? Can it keep up its aggressive — and expensive — acquisition strategy, and achieve profitability? And will agents, without whom Compass wouldn’t generate any revenue, remain happy and stay under the Compass banner? These topics are explored in Part Four: Sustainability.

Inside Compass — Part 2: Brokerage or Tech Company?

The first part of this series took a detailed look at Compass’ growth strategies, fueled by over $1.1 billion in venture capital. The company often refers to itself as a tech company and a tech-enabled brokerage, which is part of the lure of the Compass vision — and the underpinning of its massive $4.4 billion valuation. Now we turn to that fundamental question: Is Compass a tech company, or a traditional brokerage?

Ingredients of a tech company

A real estate technology company that operates as a brokerage (representing buyers and sellers in a real estate transaction) is nothing new. There are tech-enabled brokers around the world: Redfin, Purplebricks, Duproprio, and dozens of smaller players. The defining characteristic of these companies is how technology provides an efficient platform to scale — at rates much faster and at lower cost than traditional brokerages.

A real estate technology company should have the following three attributes:

  • Tech staff: A technology company should employ technologists. 

  • Efficiency: By leveraging technology, operational efficiency should be higher than the industry average.

  • Scalability: Technology should enable the business to scale in a non-linear manner.

This analysis focuses on these key attributes and compares Compass to its industry peers, both technology companies like Zillow and Redfin, and traditional brokerages like NRT (Realogy) and HomeServices of America.

Tech staff

The first clue that a company may be a technology company is the number of software engineers it employs, both in absolute numbers and as a percentage of its total headcount.

Readers that follow my work may recall a previous analysis where I benchmarked the percentage of tech staff at various real estate companies. At the time, I observed that the most successful technology-enabled brokerages around the world (Redfin, Purplebricks, and Duproprio) had around 10 percent technical staff. The point was that the business of buying and selling houses is still very much a people business, even for leading tech companies.

Compass is clearly staffing up and aggressively building a tech team. Compared to total headcount, including agents, the percentage of tech staff is still quite low (reflecting the central role of agents). However, Compass’ tech team represents a significant portion of its salaried, full-time employees.

 
source: compass public statements

source: compass public statements


Many real estate technology companies, including Zillow, Redfin, and Purplebricks, don’t publicly disclose the size of their tech teams. This is where LinkedIn comes in handy. While its employee data is not an absolute representation of the truth, it does provide a helpful comparison between companies.

Looking at software engineering staff as a percentage of the total shows a comparison between companies. (Note: software engineers are just one part of a successful tech team.)

 
source: linkedin, may 2019

source: linkedin, may 2019


Backing out agents (independent contractors or otherwise) from the same calculation shows another way to look at the same data. Remember, this is just software engineers, and not the entire product team.

 
source: linkedin, may 2019, plus author’s estimates

source: linkedin, may 2019, plus author’s estimates


LinkedIn also shows the largest employee categories for each company. The top category for Zillow, which among its peer group is undoubtedly the most tech of the tech companies, is engineering. The same engineering category is ranked #4 for Opendoor, #6 for Redfin, and doesn’t appear until #11 for Compass.

 
Zillow

Zillow

compass

compass


Raw numbers help paint a complete picture. During a Bloomberg interview in April 2019, Compass stated that it currently employs 200 engineering staffers and wants to have 400 by the end of the year. At the time of its IPO in 2017, Redfin had “more than 200 engineers and product managers” (or 9 percent of its staff), and today has nearly 200 engineers. And according to LinkedIn, Zillow has an engineering team approaching 1,000.

On the one hand, Compass is clearly outgunned by tech powerhouses like Zillow and Opendoor, but on the other hand it’s backing up its claims by aggressively hiring a sizable engineering team.

Efficiency

A classic measure of business model efficiency is revenue per person. More efficient and lucrative business models — typically technology companies — are able to generate higher revenues with a smaller staff.

The chart below looks at revenue per person (including agents, which are the drivers of revenue) during 2018. Since Zillow, Redfin, and Compass each grew their headcount rapidly during the year (from 2,600 to 9,500 at Compass), I’ve used a midpoint headcount number to reflect a more accurate representation (6,050 for Compass).

 
Screen Shot 2019-05-08 at 8.17.40 PM.png
 

It’s worth noting that Compass’ target market is the luxury space, with an average home price well over $1 million. Given that a brokerage derives its revenues as a percentage of the sale price, overall revenues will correlate closely with average sale price. The average sale price of a Compass home is about double that of Redfin, yet Redfin still generates more revenue per person than Compass.

Organizational efficiency can be measured by looking at the average number of transactions an agent is able to close each year, called “production.” One would expect a technology company, or a technology-enabled brokerage, to provide its agents greater efficiency through the smart application of technology. Those efficiency gains should translate to the ability to work on and close more transactions.

The chart below compares the average agent production for Compass, Redfin, Purplebricks in the U.K, and the industry average in the U.S.


For this calculation I’ve again used the 2018 midpoint agent count for Compass, raising its average from four to seven transactions per agent, identical to the overall industry average. Redfin’s agents, on the other hand, are 4.5 times more efficient than the industry average — an exponential efficiency gain resulting from technology combined with a novel operating model.

Another way to look at efficiency is not by total agent count, but by total headcount. This method considers the entire organization that, directly and indirectly, supports agents in closing transactions.

 
Screen Shot 2019-05-08 at 8.20.07 PM.png
 

Two interesting things happen in this analysis. First, Compass drops slightly below the industry average (represented by NRT). Second, Redfin’s efficiency lead drops to 2.5 times the industry average, a reflection of how important its non-agent support staff is to its overall model.

Looking at agent efficiency of the top 20 U.S. brokerages shows Compass right in the middle of the pack (which, incidentally, is led by Redfin). Yes, Compass is more efficient than some brokers, but its agents are considerably less efficient than a number of others, many of which don’t even style themselves as “tech-enabled brokerages.” Even agents at traditional industry stalwart HomeServices of America are more efficient.

 
source: Swanepoel Mega 1000

source: Swanepoel Mega 1000


Overall sales volume (the total value of houses sold) per agent shows another angle. Not all houses are created equal, and by being in the luxury space (average home value of $1.3 million), Compass is near the top of the pack when it comes to agent sales volumes. Its agents can sell less homes and still make a considerable amount of money.

 
source: Swanepoel Mega 1000

source: Swanepoel Mega 1000


Combining both average transactions closed and sales volume per agent shows a more holistic view of agent efficiency. Redfin, the clear outlier, operates a model that is exponentially more efficient than the industry average. Compass is clustered with other luxury brands due to its high average sales price.


When evaluating Compass, the evidence shows a business whose agents are no more efficient than the industry average — by a number of different factors. Overall business model efficiency, as evidenced by revenue per person, is singularly driven by being in the luxury market where home prices are high. Technology and product development efforts in 2019 and beyond may deliver on efficiency promises, but for the time being it remains simply that — a promise.

Scalability

Technology businesses should scale non-linearly. They should be able to grow revenues faster than expenses, and leverage technology to become more efficient over time — especially when compared to traditional peers.

Between 2016 and 2018, each of the following businesses grew revenue and added headcount, but all at different rates. Each new hire at Zillow corresponded to around $300k of additional revenue, compared to around $80k for each new person at Compass (slightly below the traditional industry average, as represented by NRT).

 
Screen Shot 2019-05-08 at 8.25.10 PM.png
 

Measuring revenue per person over time gives another sense of business scalability. One would expect a scalable technology business to see efficiency improve over time. The chart below shows the changing revenue per person — including agents — over the span of three years, again using a midpoint count in 2018 due to the rapid headcount growth in all three businesses.

 
Screen Shot 2019-05-08 at 8.22.19 PM.png
 

The evidence shows a clear trend: each business is generating revenue more efficiently as it scales. That trend is more pronounced at Zillow and Redfin, and is the hallmark of a scalable business model.

Compass is scaling differently, and less efficiently, than its peers. This does not mean that Compass is any better or worse than Zillow or Redfin — there are a variety of business models, each with their own merits — just that it is a different type of business.

The valuation quandary

Is Compass worth $4.4 billion? Should Compass be valued as a traditional brokerage, or a technology company?

The disruptive companies leading the pack in real estate — Zillow, Redfin, Opendoor, and Purplebricks — all combine technology with a novel operating model different than a traditional brokerage. It is this combination that leads to exponential gains in efficiency.

Regardless of whether or not Compass is a technology company, it unquestionably needs to be a technology company — both to support its massive valuation of $4.4 billion, and to be a lasting, sustainable business. This topic is explored further in Part Three: Valuation.

Inside Compass — Part 1: Growth Strategies

Compass is one of the world’s proptech unicorns. With a valuation of $4.4 billion and over $1.1 billion in venture capital raised, this self-styled technology-enabled broker is now the third largest U.S. brokerage by sales volume.

But how has it grown so quickly? What’s the secret to its meteoric rise, and what is it that investors see that justifies its massive valuation? This multi-part deep dive into Compass looks to provide evidence-based answers to those questions — and more.

Fundraising and growth drivers

Compass’ fundraising prowess sets it apart from its peers. It is one of the select few real estate tech companies that has raised over $1 billion in equity (Opendoor is another), and counts SoftBank as one of its investors.

Compass raised its first capital in 2012, but it was not until recently that it started raising mega rounds: $550 million in 2017 and a further $400 million in 2018.


Compass has seen a corresponding increase in its revenue and transaction volumes. Revenue has consistently doubled over the past several years as the company has become the third largest U.S. brokerage in terms of sales volume. It completed around 35,000 transactions worth $45 billion in 2018.

 
Source: author’s estimates from numerous company statements.

Source: author’s estimates from numerous company statements.


In a relatively static world of real estate market share, Compass is clearly making an impact and seeing strong growth. And its growth strategy is as unique as its fundraising ability.

A New York Yankees growth strategy

Beginning in a big way in 2016 — after a $75 million cash infusion — Compass began a new strategy of growth through acquisition.

Over the years, several sports franchises around the world, including the New York Yankees, Real Madrid, and Chelsea Football Club, have executed a particular growth strategy based on their competitive advantage: access to capital. All three clubs are rich, have access to massive amounts of capital, and use it to buy the best players in the world.

Compass operates a similar strategy; its competitive advantage in the market is capital (over $1.1 billion of it). The Compass strategy is to deploy that capital by luring the best agents and brokers to its team. Like all real estate brokerages, agent count is the primary driver of revenue.

 
Screen Shot 2019-05-02 at 9.31.21 AM.png
 

Compass employs a number of methods to attract the best talent: high commission splits, bonuses, marketing funds, and stock options. These financial factors are in addition to the softer benefits of the Compass brand, which is slick, modern, exclusive, luxury-focused, and comes with the promise of marketing and technology support (this will be explored further in Part Two: Brokerage or Technology Company).

Beginning in 2018, immediately after its massive $550 million cash infusion, Compass upped the game by acquiring brokerages wholesale. Instead of luring away only the star players, management decided it would be faster to simply acquire entire brokerages, which significantly accelerated the growth of Compass’ agent count (note the blue line in the graph below).

 
Screen Shot 2019-05-02 at 10.19.12 AM.png
 

Since the start of 2018, Compass’ agent count has increased from roughly 2,000 to 10,000. Of those 8,000 new agents, around 4,200, or 52 percent, came from acquired brokerages. The remainder can be assumed to come from traditional, organic methods (recruitment of star agents and teams).

 
Screen Shot 2019-04-29 at 3.01.29 PM.png
 

Steve Murray from REAL Trends, whose firm closely tracks and values U.S. brokerages, estimates that the acquisitions listed above cost Compass a total of between $220 and $240 million, paid in a combination of cash and stock. Compass has stated that it typically pays between four and six times a firm’s annual pre-tax earnings.

Assuming a total of $230 million spent to acquire fourteen brokerages with 4,200 agents, that’s a cost of $55,000 per agent. Quite an expensive — and effective — recruitment method.

Marketshare merry-go-round

The real estate world revolves around agents. Agents generate revenue, and that revenue gets split between agent and broker. Each year, many agents change brokerages in an effort to increase their earnings through incentives like more favorable commission splits. It’s a recruiting tool.

This marketshare merry-go-round has been going for decades. There’s always a new player entering the market with a sweet deal to attract agents with the promise of earning more money. Today, that’s Compass and eXp Realty. But what about tomorrow? What’s to stop the next wave of players offering an even better financial proposition to lure agents to its ecosystem?

Compass has achieved a tremendous amount of growth in a relatively short period of time, and its competitive advantage is access to capital. It is parlaying that advantage into a massive agent recruiting tool at scale. But that advantage may not be sustainable nor unique; it’s possible for others to copy. Nothing is stopping a new or existing player from offering even more lucrative deals to attract agents.

Brokerage or technology company?

The vision, promise, and lure of Compass is that it’s a technology company, not a traditional real estate brokerage. And as a technology company, it will deploy tools unmatched by others in the industry. This potential competitive advantage will be key to attracting and retaining agents, and a cornerstone of the Compass strategy.

Using extensive data as evidence, part two of this series explores that singular, key question upon which this $4.4 billion company revolves: Is Compass a brokerage, or a technology company?


Inside Compass: A Strategic Analysis

My epic, five-part Compass analysis in one easy to read whitepaper. Download the free PDF and enjoy!

Also check out the rest of my strategic, evidence-based analysis of Compass.

The Rise (and Fall?) of Purplebricks

If you believe everything you read in the media, you could be excused for thinking the U.K.-based online real estate agency Purplebricks is a company in crisis. The stock price is significantly down from the highs of last year, the U.S. and U.K. CEOs are out, and revenue guidance has been repeatedly downgraded.


Purplebricks faced a rocky international expansion, especially in the U.S. In a span of nine months, it quietly raised prices, completely pivoted its fee model, and then parted ways with its U.S. chief executive. During the same period, it lowered future revenue expectations not once but twice, down from total group revenues of £185 million to £140 million.


But like all irrational systems, the stock market trades not only on reality, but the perception of reality. While Purplebricks' stock has faced a turbulent three years, its underlying revenue has consistently grown by impressive margins.


The sharp rise in 2017 was driven by unrealistic optimism for international expansion, on the back of 100% growth in the U.K. In 2018 it was clear international markets were a tough nut to crack, while U.K growth slowed considerably.

Still strong in the U.K.

As I wrote in July 2018, Purplebricks' U.K. business model works, it makes money, and -- at scale -- is profitable.


It's a mistake to confuse Purplebricks' stock price with its overall success. The only challenge facing the U.K. business is growth, which is clearly slowing down as the company saturates the market. All online agents are not doomed to failure because of some fundamental flaw. 

Market share can only get so high. In November 2018 I was quoted in the Financial Times saying, "I rolled my eyes when analysts were talking about 20, 25 per cent market share [for digital leaders]." And it's true. Depending on the source, Purplebricks' U.K. market share is anywhere from 3.2 to 4.5 percent.

What's the problem in the U.S.?

The U.S challenge is simple: Purplebricks' massive marketing spend is not generating enough customers.

The company recently pivoted its business model in the U.S., from an up-front fixed fee (paid regardless of the home selling), to a success fee paid only when a home sells -- both at a discount. This move brings Purplebricks squarely in line with the traditional industry it was attempting to disrupt. The proposition is now also identical to Redfin.

In December of 2018, I estimated Purplebricks generated between 1,200 and 1,400 new listings over the preceding six month period. During that same time, Redfin reported around 22,000 closed transactions.

Also during that period of time, Purplebricks spent over $20 million in marketing, compared to Redfin's $16 million. The result is a customer acquisition cost of $15,000 for Purplebricks, compared to $730 for Redfin.

 
0b3baf87-5fa2-476b-85e7-5d0f24d276ae.png
 

Strategic implications

Purplebricks is still dangerous: it has deep pockets, a willingness to spend, and the self-awareness to pivot when things aren't working. I wouldn't count them out of the U.S. quite yet.

The biggest implication, however, could be the massive amount of money being spent on marketing by disruptive players (over $100 million between Purplebricks and Redfin alone in 2019). And what's the message of that marketing? Traditional agents are expensive, we offer the same service at a discount, use us instead.

Expand the scope to iBuyers like Opendoor and Zillow and the tens-of-millions they are spending on marketing. What's the message? Traditional sales are complicated and confusing, use us instead.

Disruptive companies are spending hundreds-of-millions of dollars on TV commercials, radio ads, and online advertising that hammers home a clear message to consumers: a credible alternative to traditional real estate.

Now, more than ever before, consumers are being bombarded with advertising offering them a choice. The industry may not change overnight, but consumers will be asking more and more questions.

Axel Springer goes all in on hybrid agents

How many international media conglomerates -- that own a number of leading real estate portals worldwide -- have “hybrid agents” as one of its top strategic priorities? Just one: Axel Springer.

Why it matters: Axel Springer, the $6 billion European media house, is going "all in" with online hybrid agents, through its investments in Purplebricks and Homeday. It's making a calculated bet that competing with its real estate agency customers is the best long-term strategy.

Making hybrid agents a strategic priority

Dozens of the largest real estate portals around the world are owned by a small collection of international media companies: News Corp, Schibsted, Naspers, and Axel Springer. But of them all, only Axel Springer has taken the step of investing in a potential sector disruptor: the online hybrid agent.

Axel Springer owns major real estate portals in France, Germany, Belgium, and Israel. In March 2018, it made a bold, £125 million investment in Purplebricks. The investment is notable because Axel Springer owns several top portals whose customers are the same real estate agents that Purplebricks is trying to disrupt (albeit in different markets).

Furthermore, Axel Springer is the only major international entity that has targeted online hybrid agents as a future growth priority. In its latest presentation to investors, hybrid agents are included as a top priority for the core classifieds business (which generated revenues of over €500 million in 2017).

Disrupting its biggest customers

Axel Springer's strategy offers a fascinating juxtaposition: Adding value to traditional agents by providing more services (seller leads), while "satisfying even more consumer needs" with its hybrid agents -- which directly compete with traditional agents.

6940f74d-bf19-4e12-8794-d4893023dd1f.png

Axel Springer is wonderfully upfront about its motivations. Its move into the hybrid agent space is designed to tap into a much larger revenue pool: agent commissions.

efdef2ce-654a-48c4-9bf7-a56633e24f3b.png

Continuing to serve your customers while entering into direct competition with them is a delicate balancing act. It's a move reminiscent of Amazon promoting its own products in direct competition with many of its sellers.

This is the nightmare scenario that U.S. real estate agents have been predicting for years. But in this instance it's not Zillow, but one of Europe's most powerful players, taking active steps to disrupt agents.

Winner take most

It's been clearly illustrated in the U.K. market that the online agent space is winner take most (market share). Access to capital is the single biggest predictor of success.

There is no first mover advantage in these markets (Purplebricks was not the U.K.'s first online hybrid agent). Rather, there is a rich first mover advantage: the business with the deepest pockets generally wins.

In this regard, Axel Springer and Purplebricks form a powerful combination. From a competitive standpoint, the most dangerous thing about Purplebricks is its investment risk tolerance. It is willing to invest tens-of-millions of dollars year after year to build market share -- incurring big losses along the way. And with Axel Springer and its deep pockets along for the journey, it's a hard combination to beat.

Strategic implications

Axel Springer and Purplebricks are quickly building a potentially insurmountable lead in the online hybrid agent space globally. There is no runner-up in the sector; it's a one horse race.

Purplebricks has proven the online hybrid model works in the U.K., and is aggressively launching in other markets. Copycats are popping up around the world. What's stopping News Corp, Schibsted, and Naspers from entering the space? It's either capital, ambition, or fear of upsetting their agent customers.

Real estate portals are moving from search engine to service engine; they are moving closer to and becoming involved in more of the transaction.

There is undeniable momentum in this direction. While not every portal is seeing success, the shift is clear -- and unyielding. Axel Springer's bet on online hybrid agents, in direct competition with its real estate agent customers, is the latest example of this evolving strategy.

My Proptech CEO Summit Presentation

It was my pleasure to present at the invite-only Proptech CEO Summit in San Francisco, hosted by former Trulia execs and current venture capitalists, Paul Levine and Pete Flint. There were over 100 proptech CEOs present, including Glenn from Redfin, Eric from Opendoor, and many others.

I want to share my entire presentation from the event, in addition to highlighting a few key points.

PropTech and PropPsych

The first point deals with the critical role of human psychology in real estate transactions, and the concept of loss aversion (for more, check out How Psychology is Holding Back Real Estate Tech).

Human psychology is the single biggest obstacle to mainstream adoption of new technologies in real estate. The point I made in my presentation is this: every venture capitalist should be asking proptech start-ups how they are going to address loss aversion.

And the inverse is true: each startup should clearly explain how its product or service is designed to minimize loss aversion in consumers.

Building the technology alone is not enough. Real estate tech companies need to assure consumers their product is just as "safe" as the status quo. PropPsych is just as important as PropTech.

Solving problems with money

The second point relates to the massive amounts of money flowing into the ecosystem. To quote Glenn Kelman, "If we can afford to lose money for five years, how can we ever make money?"

The biggest players in the space -- Opendoor, Purplebricks, and Compass -- have raised hundreds of millions to over a billion dollars each. The next tier of start-ups have raised tens of millions of dollars each.

But none of these companies are actually doing something new; they're doing what's possible with massive amounts of capital.

Yes, there are novel aspects of the business models that allow these business to realize gains in efficiency, or provide a superior customer experience. But all are underpinned by massive amounts of capital.

The reason that Compass can buy market share, Purplebricks can generate tons of leads through advertising, and Opendoor can buy thousands of homes is access to vast amounts of capital.

My presentation

Attached below is a link to my presentation on Slideshare (you can also download the PDF). Unlike my numerous industry reports, this is designed to be delivered in person. But hopefully it helps you and your business.

Purplebricks' H1 2019 Results

Last week, Purplebricks released its half-year financial results. The top line results include an overall group loss of £27.3 million for the period, with a slight reduction of its full-year revenue guidance. But the top line numbers don't come close to telling the full story (hint: it's not as bad as it sounds).

Why it matters: Purplebricks' core U.K. market continues to grow and is meaningfully profitable, proving that the model works. Key performance indicators in its other three markets reveal a deeper story of investment, growth, and challenges.

Continued growth in the U.K.

The popular narrative is seductive, but factually incorrect: With massive losses at Purplebricks and the demise of online agent Emoov (which, by the way, was not the second largest online agent in the U.K.), the entire online agency business model is near collapse. Not quite.

Purplebricks is an international collection of businesses at various stages of growth. In the U.K., Purplebricks' most mature market, it continues to grow revenues and operating profit. At maturity and scale the business model absolutely works; there is no evidence to support otherwise.

Yes, growth is slowing in the U.K. But at nearly 80,000 instructions per year it can't be expected to keep growing at historic rates. The key is that even in a challenging economic climate, growth continues.

Bumpy ride in Australia

While progress in the U.K. is consistent and positive, Purplebricks' Australian operation has endured a turbulent year. Senior management changes, a business model pivot, and its fair share of negative press has resulted in a "bump in the road" over the last six months.

Revenue growth is up year-on-year, but down from the previous six months, with a corresponding hit in operating profit.

One data point does not make a trend, so all eyes are on the next six months as Purplebricks executes its Australian turnaround plan with a new team and new pricing strategy.

Deep investment in the U.S. market

Purplebricks continues to invest heavily in its U.S. rollout. Over the past six months, it has spent over $20 million on sales and marketing across seven States -- more than double what it spent last year.

Purplebricks managed between 1,200 and 1,400 instructions in the U.S. over the past half-year, or around 200-230 per month. The cost per instruction has dropped from around $21,000 to between $14,000 and $17,000 (each instruction is worth $5,205 in revenue to Purplebricks).

At the current rate, Purplebricks will need to go from 200 to 650 instructions per month to reach breakeven with its sales and marketing costs, and to 1,000 instructions per month to reach profitability.

To achieve profitability, Purplebricks will need to get all of its launch markets performing well, not just L.A. One example is the lackluster performance in Phoenix, as I wrote about last week.

Marketing efficiency

At its core, Purplebricks is as much an advertising company as it is a real estate company. The business model relies on a massive marketing expenditure to generate leads for its network of agents. Thus, one of the most important metrics for the business is marketing efficiency.

For every £1 spent on marketing, Purplebricks generates revenues of £3.60 in the U.K., £0.92 in Australia, £0.36 in the U.S., and £4.38 in Canada (Purplebricks' Canadian acquisition was a fantastic deal).

Strategic implications

The core Purplebricks business model -- and profitability at scale -- is sound. The market failure of smaller players, or the fact that Purplebricks is deeply investing in new markets, doesn't diminish that fact.

From a competitive standpoint, the most dangerous thing about Purplebricks is its investment risk tolerance. It is willing to invest tens-of-millions of dollars year after year to build market share -- incurring big losses along the way. If you're a traditional real estate agency, or a listed company, are you willing to do the same?

Purplebricks struggles in Phoenix

I had high hopes when Purplebricks launched in Phoenix earlier this year. It was the first U.S. market in the "sweet spot" for the Purplebricks proposition. However, the latest numbers show quite modest traction: 75 listings and 26 sold properties over five months.

Why it matters: This data presents a healthy counter-balance to Purplebricks' rapid, national expansion. Launching in a new market is very different than gaining meaningful traction in a new market.

Mid-market America

In July, I analyzed Purplebricks' FY18 results. The analysis highlights the massive investment the business made with its U.S. launch, with an effective cost per listing of over $21,000.

There's also the question of if Purplebricks launched in the wrong markets. Southern California and the New York metro area are expensive markets, while the data clearly shows the Purplebricks proposition resonating with mid-market customers. Phoenix is that market.

After a slow start, Purplebricks is averaging a few dozen new listings per month in Phoenix. With a listing fee of $3,600, that's around $75,000 in revenue for November.

Purplebricks is also struggling to recruit and retain brokers in Phoenix. Agent numbers are stagnant, and the average number of listings per broker is two. If we assume a broker is paid $1,000 of the $3,600 listing fee, that's a very low effective annual pay package. (Broker numbers can be tracked on the Arizona Department of Real Estate web site.)

The right market

I still believe Phoenix is the right market for Purplebricks. The 75 Purplebricks listings are right in line with the median average for the Phoenix market (Maricopa County), which is a positive sign. This -- not more expensive markets -- is the sweet spot for the fixed-fee proposition.

Growth is the name of the game

The U.S. real estate market is undergoing significant change. New (and existing) players like Redfin, Compass, and eXp Realty are rapidly growing market share -- at the expense of traditional incumbents.

All of these players, including Purplebricks, have raised massive amounts of capital to grow market share. Growth is measured in tens-of-thousands of new listings.

Phoenix is just one market out of several in the U.S. where Purplebricks has launched. In its first eight months, Purplebricks had 582 total listings nationally. After five months in Phoenix, 75 total listings is a comparative drop in the bucket. If Purplebricks wants to make a dent in the U.S., these numbers need to be in the hundreds and thousands.

Another data point: A quick check on Zillow shows 288 active listings for Purplebricks (primarily in California); it had 289 back in June. By comparison, Opendoor grew from 721 to 3,163 active listings in the same period.

Strategic implications

Purplebricks' success in the U.S. market is not assured. Raising a lot of money doesn't guarantee success. And an organic pathway to growth takes large amounts of time, patience, and capital.

Execution of this model is very much market-specific, and a lot of hard work. The business model scales linearly with people; technology is just an enabler.

Is Compass really a tech company?

Earlier this month, The Real Deal published an excellent article about Compass. And the article included one of my favorite things: numbers.

Why it matters: Opinions aside, the latest numbers allow us to compare Compass to its peers, and really answer dual questions: Is Compass doing anything novel in the industry, and is it really a technology company?

Comparing growth rates

I'll be comparing Compass to two of its peers: Redfin and Purplebricks. Both businesses, which I know well, represent the most successful new models in real estate that are changing the way people buy and sell houses. They are successful in terms of overall revenue and transaction volumes, demonstrating market traction at scale.

Overall revenue growth for all three firms is growing impressively. It's undeniable that Compass' revenue growth is accelerating.


The core of the Compass business model is making acquisitions. Armed with $800 million in venture capital, it is aggressively buying up agents and brokerages.

Transaction volumes are all increasing. Again, Compass' projected growth in 2018 is impressive, but that's what happens when you buy market share. By comparison, Redfin and Purplebricks are growing organically.


Is the Compass model novel?

The Compass investment thesis centers around technology. It claims that it is a tech company (with tech company valuations), and is building the "first modern real estate platform" that provides "real estate agents tools that increase efficiency."

The data has yet to prove out this thesis. Starting with another tech company, Redfin, the numbers show that it is clearly a more efficient business than Compass -- because its operating model is different.

For Compass 2018, I've included two numbers: 7,480 is the total current number of employees, while 4,800 is the midpoint between 2017 and 2018. Given that Compass is growing so quickly, it makes sense to look at both to calibrate the comparison.

The data above is total number of employees. If we look at overall agent efficiency, as I did earlier this year when comparing Compass, Redfin, and Purplebricks in the U.K., the contrast is more pronounced.

The evidence shows that, at best, Compass agents may be incrementally more efficient than the industry average, but Redfin and Purplebricks agents are exponentially more efficient.

Compass' growth strategy is novel: raise a massive amount of capital and use it to acquire market share. But the operational model of the business is fundamentally the same as every other traditional brokerage -- as the data around efficiency shows. It's not really changing the industry in the same way that Redfin, Purplebricks, or Opendoor are -- it's just moving market share around.

Is Compass a technology company?

Analysis I conducted in early 2018, as part of my Emerging Models in Real Estate Report, showed that -- roughly speaking -- about 10 percent of the staff of global leaders was technical. Compass was the outlier at 4 percent.

96d595ef-5ec9-4407-be46-4a2a6a843566.png

Using the latest data (7,480 total employees and a 200-person tech team), that percentage has dropped to 2.7 percent.

Even if you calibrate for Compass' fast agent employee growth through acquisition, the overall percentage is still considerably lower than its peers.

Strategic considerations

There are a few final points to consider when looking at Compass:

  • Being a tech company is not a binary thing, but what is clear is that Compass is less of a tech company than its peers.

  • As opposed to Purplebricks and Redfin, Compass' customer is the agent. The technology it is building is for agents, not consumers.

  • True, exponential efficiency gains come with technology combined with a novel operating model. Technology alone won't deliver it.


How Psychology is Holding Back Real Estate Tech

I was recently on the opening panel at Inman Connect, where the topic was the future of real estate. The conversation centered around the role of technology in the real estate transaction, and the future role of agents (watch the full video).

When I think about the modernization of the industry and technological adoption, my position is that what’s holding us back is psychology, not technology.

It's the psychology, stupid

The big U.S. real estate incumbents can’t stop talking about technology. Each week brings a new announcement about plans for new tech platforms, investments, and initiatives. And while industry gurus love to talk about the impending perfect storm of technology that will revolutionize the industry, I think they’ve got it wrong, and are repeatedly missing a key point.

That key point is human psychology, and the principle is loss aversion. In cognitive psychology and decision theory, loss aversion refers to people's tendency to prefer avoiding losses to acquiring equivalent gains: it is better to not lose $5 than to find $5. (Read more about loss aversion on Wikipedia).

In other words, consumers will prioritise avoiding costly mistakes over making (or saving) more money. 

It’s relatively easy for technology to disrupt high-frequency, low-value transactions. The risk (or potential loss) is low, both due to the small value of the transaction and the frequency with which it occurs. Think services like Uber, Airbnb, and Netflix.

On the other end of the spectrum, it is more difficult to disrupt low-frequency, high-value transactions with technology, because the potential loss from a mistake is so much greater. People typically go to specialists to help with these transactions: divorce lawyers, investment bankers, and expert consultants.

A real estate transaction, by comparison, is off the charts: it is ultra low-frequency, ultra high-value. The potential loss that occurs from making a mistake is huge.

The psychological desire to engage a specialist in these high-value transactions is loss aversion at work. People are willing to pay top dollar to secure a form of insurance on the transaction; someone to hold their hand through the process. Even when cheaper, tech-focused alternatives are available.

It's not technology holding the industry back, it’s psychology. And no software platform, artificial intelligence chatbot, or mobile app is going to change that.

The role of technology

When it comes to real estate, technology has a dual role: making agents more efficient, and providing a better customer experience. It’s not about replacing agents or removing the insurance of having a specialist involved.

This is where the incumbents — with their regular announcements of big technology plays — are at a disadvantage, and the newcomers have the advantage.

It's the businesses that are built from the ground up around efficiency that have the advantage. More efficient agents means less agents. For a big incumbent to make this change would require an entire retooling of the business, and firing a massive amount of staff and agents. It's too disruptive, and classic innovator's dilemma.

The best way to illustrate this point is agent efficiency: how many deals a typical agent closes each year.

Compass, for all its talk about using technology to make agents more efficient, has yet to demonstrate a significant impact. On the other hand, businesses built from the ground up that utilize technology to improve agent productivity are seeing dramatic gains in efficiency: a 7x improvement at Redfin and a 10x improvement at Purplebricks in the U.K. That's exponential improvement vs. incremental improvement, and is the real eye-opener in the industry.

Strategic implications

Successful new models in real estate understand the key point: smartly combine people and technology. They understand of the role of technology (efficiency and experience), and the role of psychology.

Investors and entrepreneurs assuming that tech will disrupt the real estate industry in the same way it has with low-value, high-frequency transactions are taking a myopic view. It's psychology holding us back, not technology.

If you're interested, be sure to check out the video from the full panel discussion (around 25 minutes) from Inman Connect 2018.

Analyzing Purplebricks' FY18 Results

Earlier this month, Purplebricks announced its full-year financial results for 2018, with revenues doubling to £93.7 million.

Why it matters: This is the first public glimpse into Purplebricks' U.S. launch, and across the entire group, there are a number of key takeaways:

  • The U.K. business is materially profitable.
  • The U.S. launch is very expensive, and tracking behind Australia in key metrics from the first eight months.
  • Marketing ROI in the U.K. is flat.

Coverage of Purplebricks

The media and the overall industry's response to Purplebricks' really grinds my gears.

The headlines are all negative, and revolve around "mounting losses" at the business. Some alternate -- and just-as-true -- headline suggestions:

  • Revenues double (again) at Purplebricks
  • Purplebricks' international expansion makes gains
  • Purplebricks maintains steady growth and profitability in the U.K.
unnamed.png

But none of these are as sensational -- nor do they play into the existing narrative -- of mounting losses for a doomed business.

Then you have the inevitable "the sky is falling" comment from the investment bank Jefferies, whose singular achievement has been being consistently and definitively wrong on the sector for the past three years (if you invested money on their recommendation you would have lost 88%). It's alarming that they still have enough credibility to be the go-to quotable source for these matters.

The narrative of "mounting losses"

What's most surprising about the "mounting losses" narrative is that it is unsurprising. Purplebricks recently raised £100 million from Axel Springer. The value of £1 sitting in the bank is exactly £1. Wouldn't you expect Purplebricks to spend it instead?

And like all growing businesses (the financial markets still like growth, right?), you need to spend today to make money tomorrow. The majority of growth-stage businesses are in the same boat -- which is exactly why they are raising money and spending it.

When you spend money today in an effort to grow your business, it's called investment. It's "losing money" in the same sense that you are "losing flour" when you bake bread. It's not about "mounting losses" in your flour reserves; it's about what you can make with that flour.

Materially profitable in the U.K.

Now on to the analysis! The first and most important takeaway from the results is that the U.K. business is materially profitable. The model works, it makes money, and -- at scale -- is profitable.

Whether you look at operating profit (£4.2 million), adjusted EBITDA (£8.1 million), or my preferred EBITDA with stock-based compensation added back in (£5.7 million), the business is finally generated profits after years of investment.

 
unnamed-1.png
 

The U.S. launch takes shape

The big question on everyone's mind is how the U.S. launch is tracking. Based on the numbers reported in its full-year results, Purplebricks USA generated $2.6 million in revenue from around 580 listings.

 
unnamed-2.png
 

That comes out to a hefty cost per listing of around $21,000 (compared to around $400 per listing in the U.K.). To put that in context: it's still early days so that number should be high, and, wow, that number is pretty high.

Comparing the first eight months in a new market: Australia vs. the U.S.

What I find most interesting is a direct comparison of Purplebricks' first eight months in Australia and the U.S. It's clear that Purplebricks is going big in the U.S., spending more than double what it spent for its Australian debut.


But the increased spend isn't yielding results (yet). Despite the massive spend, revenues in the U.S. are still small, with a return on investment about 1/4 of that in Australia. Remember: this is a direct comparison of the first eight months in a new market.

You're probably wondering why. It's a complex situation, but for starters Purplebricks may have launched in the wrong U.S. markets, as I've written about previously.

A few other points to note when comparing launch markets:

  • The price points are about the same: $3,200 in the U.S. compared to $3,300 USD in Australia at launch.
  • The first eight months in Australia yielded around 1,050 listings, compared to around 580 in the U.S.

One factor that's really driving costs in the U.S. is the sales and marketing spend, which is expensive in the launch markets of Los Angeles and New York City. Compared with its Australian launch, Purplebricks is spending more than double.

 
unnamed-4.png
 

Marketing ROI flat in the U.K.

One impressive aspect of the Purplebricks operation is its marketing efficiency. I've always been interested in the customer acquisition costs, as it's a critical KPI for the online agency model.

As we can see, the cost per instruction (CPI) has improved slightly from last year, but is relatively flat. (My chart is on the left, with Purplebricks' own chart on the right.)

A more granular view of the overall marketing ROI (revenue / sales and marketing) shows an overall improvement, but with a recent dip.


This is no cause for alarm. Marketing ROI is still positive and a number of factors may be at play here, including the overall housing market in the U.K. But the data does show a change from what we've seen in the past. Keep an eye on this.

Purplebricks expands to Canada in a big way

Last week, Purplebricks announced that it had acquired DuProprio/ComFree, the leading fixed-fee and for-sale-by-owner business in Canada, for £29.3 million.

Why it matters: This is a great deal for Purplebricks and further strengthens its position as the online agency leader with global ambitions.

Disclaimer: I played a small but important part in this deal, and in the past I have done strategy work with DuProprio. All information in this update is in the public domain (and sourced), and the opinions are my own.

Deal background

If you're looking at the leaders that are changing the way consumers buy and sell houses, two of the biggest global names are Purplebricks and DuProprio.

DuProprio/ComFree is one of the most successful real estate companies no one has ever heard of. I've written about the business in past. Why is it a big deal? With a model similar to Purplebricks, it lists over 40,000 properties each year (about the same number as Purplebricks last year), generates over $40 million (Canadian) in revenues, and has over 20 percent market share in Quebec (by comparison, Purplebricks has around 5 percent market share in the U.K.).

This deal represents two global leaders combining forces under one banner, and an excellent market entry into Canada for Purplebricks.

A big boost for Purplebricks

This acquisition is a big deal for Purplebricks. From a revenue standpoint, Canada immediately becomes Purplebricks' second-largest market.


That's a 25% bump in revenue from just one deal. And what a deal it was.

Deal of the year?

Purplebricks acquired DuProprio for a steal. Let me illustrate by looking at the relative enterprise value (EV) of each business compared to their revenues (source).


This is huge. The financial markets are valuing the Purplebricks business at a ratio ten times higher than the implied value of DuProprio.

In other words, when Purplebricks spent £29.3 million to acquire DuProprio, it instantly created nearly £240 million in value to shareholders (£23 million in revenues valued at Purplebricks' revenue multiple).

The big question is why DuProprio was valued so low. It was acquired by the Canadian Yellow Pages in 2015 for $50 million Canadian, and sold in 2018 for $51 million Canadian. This quote provides our only clue:

"As we continue to streamline and focus our operations, we believe the divestiture of [DuProprio/ComFree] is another very positive step for Yellow Pages and our stakeholders. Under the terms of our senior secured notes, the cash proceeds will be included in the next scheduled note redemption payment, on November 30, 2018" said the Company's Chief Executive Officer, David A. Eckert. 

DuProprio's revenues in 2014 were around $40 million Canadian (source), and Purplebricks' guidance is for around $43 million Canadian in revenues for its next financial year. So while the business has not gone backwards under Yellow Pages, growth has been muted.

Build vs. Buy

The question of build vs. buy is always top of mind when a business looks to enter a new market. Does it spend big money to launch an operation from scratch, or simply acquire an existing player?

Including Canada, Purplebricks has now entered three new markets. In the case of Australia and the U.S., it started from scratch, spending big to build market share over a number of months and years.


Based on its full-year financial results, Purplebricks spent £17.8 million to generate £2 million in revenue in the U.S. Those are expensive -- but not surprising -- start-up costs for a big new market.

Over the past 20 months in Australia, Purplebricks has spent £26 million to generate £17 million in revenues. It's taken a long time and a big investment, but that business is finally approaching breakeven.

By comparison, Purplebricks spent £29.3 million for £23 million in revenues in Canada, a materially better ROI, that took no time at all. And keep in mind that's a one-time expense; the revenues keep on coming year after year.

It's not every day an opportunity like this comes up. But given the chance, buying its way into Canada was a smart move for Purplebricks.

Strategic implications

A few key takeaways stand out from this deal:

  • Global by design. International expansion is a unique and key tenet of Purplebricks' strategy. No other company in this space (Opendoor, Redfin, Compass, Emoov, Yopa, and dozens of others) has expanded beyond one market. Purplebricks is now in four.
  • A great deal. This was a good use of capital and has manifested in a new, valuable asset for Purplebricks. Good deals like this exist in the space; you just have to know where to look.
  • Canadian growth potential. With new (and arguably better capitalized) ownership, DuProprio/ComFree is primed for growth, with Purplebricks ready to invest £15 million further into the business.

Traditional agents wade into instant offers

A Keller Williams team in Phoenix recently launched OfferDepot, an instant offer play, to "help with all the confusion with cash offers vs bringing your home to market."

Why it matters: This is the first move from a traditional real estate company into the instant offers space.

Welcome, incumbents. Seriously.

The idea that traditional real estate incumbents would enter into the iBuyer's instant offers party isn't new. Back in February, I wrote:

"...the more successful Opendoor becomes, the more of a threat they become to industry incumbents, which forces them to respond. The most logical response from a major player such as Realogy or Keller Williams would be to launch their own iBuyer program."

This isn't a top-down corporate initiative on the part of Keller Williams. Rather, this is a local team reacting to the rising interest in iBuyers and pushing to stay relevant.

The Keller Williams team isn't buying houses directly. It is collecting inbound leads from potential sellers, gathering information on the home, receiving instant offers on their behalf, and presenting everything back to the home owner (including an option to list the home on the open market) in a comparative analysis.

Why now?

We can speculate as to the reasons this Keller Williams team decoded to jump in to the fray:

  • It doesn't want to miss the boat. Whether it's Opendoor raising another $325 million or Zillow jumping in with both feet, interest in the space has never been stronger. Traditional real estate agents -- and Keller Williams -- are in the business of selling homes. Why would they let this new model pass them by? Doing nothing is not an option.

  • A one-stop-shop. It's relatively easy for traditional agents to bolt on an instant offer service, thereby turning them into a one-stop-shop for home sellers (and negating the need to contact an iBuyer like Opendoor or Offerpad).

  • Seller leads are super valuable. This is another form of lead generation for traditional agents, with each request representing a likely customer.

Implications for iBuyers

In my previous analysis, I summed up the major implications of incumbents entering the instant offer space. The first deals with the user experience:

"Make no mistake, the offer and the experience from the incumbent is going to be bad. They’re simply not set up to provide the same quality of service as Opendoor."

The online experience isn't great. In a design reminiscent of the mid- to late-90's, users must struggle through a form to submit their home's information. It's a far cry from the premium experience Opendoor strives to offer its customers through the entire process.

But it works. It does what it needs to and collects leads. And it is this dilutive effect that is the biggest implication to dedicated iBuyers like Opendoor. As I wrote in that same analysis:

"The proposition from the incumbents will be poor, but it will be enough to soak up a portion of the demand in the market and take momentum away from Opendoor and other iBuyers."

It's simple economics. If we assume the demand remains constant, the addition of supply will dilute the amount of business any one iBuyer receives.

There will also be more customer confusion as incumbents get into the game. When Opendoor was the only option in town, it was simple. But now there are a variety of choices: multiple dedicated iBuyers (Opendoor, Offerpad), a popular web portal (Zillow), a tech-enabled brokerage (Redfin Now), and a traditional real estate agent (OfferDepot). What's the difference? Who do I trust? It's difficult to explain the various propositions to consumers.

At the end of the day, that's good for traditional brokers and agents (as they can soak up additional demand), and bad for dedicated iBuyers (because of the dilutive effect and customer confusion).

Where to from here

This is just the start! Expect a lot more activity in this space by the incumbents. It's only a matter of time before a big incumbent launches a well-funded, well-designed initiative. And it may not stop at just presenting offers on an iBuyer's behalf...

Online agents consolidate in the U.K.

Two of the top runner-up online agencies in the U.K., Emoov and Tepilo, recently merged their businesses in an effort to grow market share and more effectively compete with leader Purplebricks.

Why it matters: This is the first major online agency consolidation, a natural result of unsustainable unit economics at low volumes.

Winner take most; followers fight for relevancy 

As I've highlighted in the past, the online agency sector in the U.K. is a "winner take most" market. Purplebricks, the leader, has 70%+ market share of the online agent segment.

39a135f7-f989-4de9-8324-4f7e1efc8772.png

The online agency business model only works at scale. A key hallmark of the model are low fees combined with centralized and specialized operations that process listings at an exponentially higher rate than traditional agents.

Purplebricks is profitable in the U.K.; the others are not. The unit economics are favorable at scale (thousands of listings per month), but anything less is a money-losing endeavor. Given this, industry consolidation is a natural outcome.

Runner-up spot up for grabs

As in my last analysis, using updated new listing data from Rightmove shows two clear trends:

  • The #2 spot behind Purplebricks is very much up for grabs. The combined Emoov+Tepilo entity is neck-and-neck with Yopa (in terms of new listings per month).
  • Yopa is seeing sustained, strong growth, nearly doubling its business since January.
49625871-cf75-48a3-9315-170106b032e1.png

Purplebricks is still the undisputed leader, with 5.9 times the new listings of Yopa and 7.6 times the new listings of Emoov+Tepilo for the month of May. 

It's also worth noting that Yopa is seeing strong growth since its capital raise last year. One can imagine that the business is spending big to acquire new customers, so it is unlikely to be sustainable or profitable. But it is growth nonetheless.

Total market share of the top 5 online agents is down slightly to 5.4 percent (based on new listings) in May. Post-merger, I would expect increased activity from Emoov+Tepilo that grows overall market share.

Strategic implications

This deal raises several important considerations in the online agency space:

  • Expect more industry consolidation, and for the slower horses to eventually drop out. The math is simple; the model doesn't work at low volumes.
  • Pay now vs. pay later. When considering the relative traction of Purplebricks vs. Yopa, Emoov, and Tepilo, keep in mind that all of the Purplebricks customers are committing to paying upfront; Yopa and the others offer options to defer payment until after a successful sale. In that sense, it's less surprising that Yopa is seeing such strong growth (no risk for new customers).
  • Two brands or one? Emoov has announced that it will retain both the Emoov and Tepilo brand. This may not allow the combined entity to realize the full synergy of consolidation, but we'll have to see.

Purplebricks targets mid-market America (finally)

Purplebricks launches in Phoenix and Las Vegas this week. This is on the back of its previous launches in Southern California and the New York metro area, and is the latest step in its U.S. expansion.

Why it matters: This is Purplebricks' first foray into mid-market America, the true sweet spot of its business model.

Picking the right target market

Purplebricks’ U.S. launch strategy is markedly different in terms of target markets. In the U.K. and Australia, evidence shows that the typical Purplebricks customer is at the mid-end of the market. However, the U.S. launch targeted high-end markets and customers.

In June of last year, Purplebricks CEO Michael Bruce said the average Purplebricks customer in the U.K. sold for around £240k (data on tens-of-thousands of transactions backs this up). The average house price in the UK is around £230k. 

To use Mr. Bruce’s own words, Purplebricks' success is down to "a higher concentration in the heart of the market rather than the top end where it has been extremely tough."

The story is similar in Australia. An analysis I conducted in 2017 shows similar trends in Victoria and Queensland. My analysis shows an average sale price of $415k AUD in H1 2018, below the overall market median home value.

779947e7-da69-49b5-946c-1df8ac2a942d.png

Then we come to the U.S. According to Zillow, as of January 2018 the median home price was $229k.

Los Angeles County, Purplebricks’ launch market in the U.S., has a median home price of $583k. San Diego County, one of the next launch markets, has a median home price of $540k. And Purplebricks’ latest launch market, the New York Metro area, has a median home price of $374k.

An analysis of 150 Purplebricks listings in the U.S. shows a median listing price of $552k. All of these numbers are significantly higher than the national average (in some cases, over twice as much).

Purplebricks decided to launch in U.S. markets where the median home value is more than double the national average. That’s a completely different launch strategy than its successful international markets.

It’s like taking a budget airline that caters to price-conscious families and launching a New York-to-London route for business travelers. It might not be the right fit. And for a business very much reliant on marketing spend to generate leads, it picked two of the most expensive advertising markets.

The Purplebricks proposition challenge

Purplebricks is clearly the low cost option when compared to alternatives in the U.K. But in the U.S., that's not the case.

In the U.K., the cost savings versus using a traditional estate agent are clear: on average, a home seller saves around £2,000 (outside of London and using national median home sale prices). And yes, this fee is paid upfront regardless of an eventual sale or not.

In the U.S., however, Purplebricks’ price-point puts it right in the middle of a crowded pack (and it just raised its fee from $3,200 to $3,600). It’s less expensive than a traditional listing agent. It’s slightly less or slightly more than Redfin depending on a 1 percent or 1.5 percent Redfin fee, and it’s slightly more expensive than other fixed-fee providers like Redefy and Trelora.

And that’s just the listing fee, which is paid regardless of the house selling or not. A homeseller still needs to pay a typical buyer’s agent fee of 2.5–3 percent.

In short, Purplebricks is not the clear low-price leader that it is in the U.K. There are a number of alternatives, Redfin being the biggest. And the competitive field is big, leaving Purplebricks with a relatively undifferentiated product in a crowded field (this is also true in the U.K., but the difference is that Purplebricks is already #1 in that market).

Strategic implications

There are a number of key points to consider in Purplebricks' U.S. expansion:

  • Its U.S. launch markets were not in its "sweet spot." Phoenix and Las Vegas are, which begins the true test in the U.S.
  • Advertising in L.A. and New York is expensive. Expect Purplebricks to get more bang for the buck for its advertising dollar in mid-range markets like Phoenix.
  • Purplebricks is operating in a crowded marketplace of low-cost and fixed-fee alternatives. It is not the least expensive option, and Redfin is a sizable competitor.