Compass’ Cash Crisis Closes


After 15 months of cost cutting, Compass is free cash flow positive, making more money than it spent in Q2 2023.

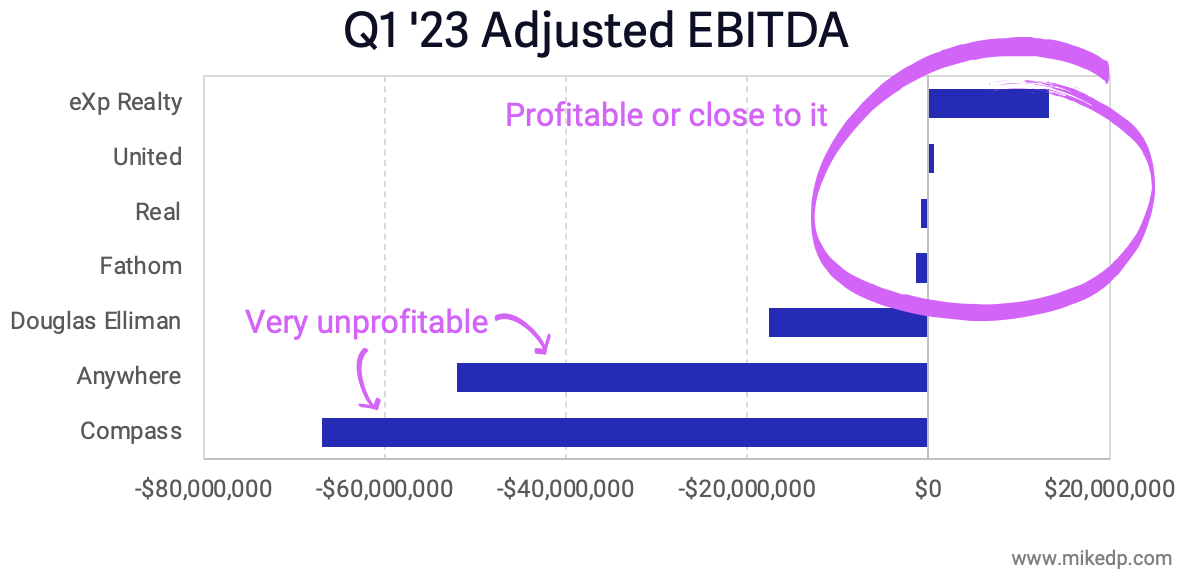
Why it matters: With a high cost base and dwindling cash reserves, Compass was forced to cut operating expenses as it pivoted to a profitable, sustainable operation – which it has done.

Dig deeper: I first wrote about Compass' cash burn problem in May 2022, and it's been a busy 15 months.

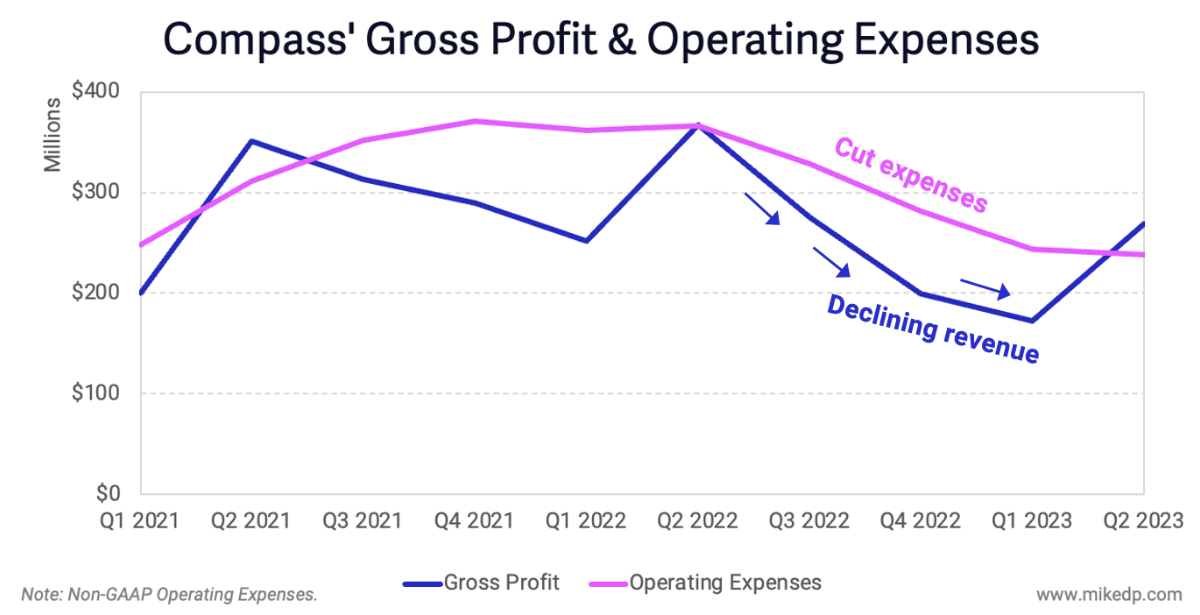
  • Over the past year, the company has cut expenses by about 35 percent – or $500 million – through three rounds of layoffs.
     

  • Compass’ annual operating expenses have dropped from $1.45 billion to $950 million, with a goal of getting down to $900 million by the end of the year.


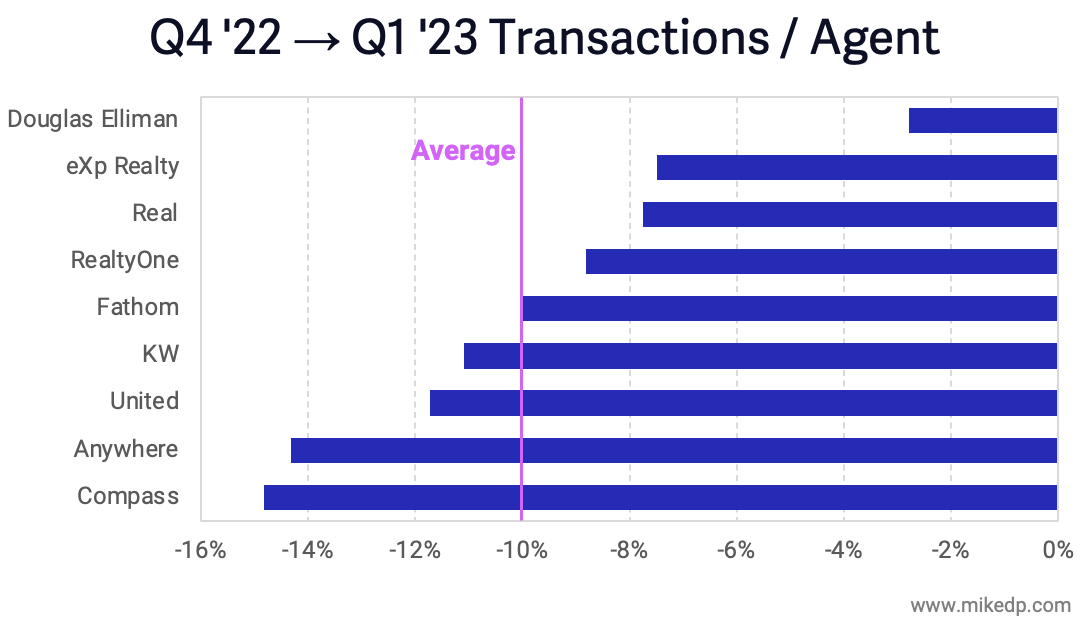
A declining market is an especially challenging time to achieve profitability.

  • As of Q2 2023, Compass’ trailing 12 month revenue was $5 billion – down from $6.7 billion a year ago.
     

  • Which means cost control is the only realistic option available to get cash flow positive.


Compass’ cash balance has stabilized at $335 million – and, in fact, has increased for the first time in years.

  • Management clearly has confidence in the business: in July, it repaid the outstanding $150 million draw from its revolving credit facility.


What to watch: Compass isn’t entirely out of the woods yet, but it’s on a much more solid foundation.

  • This past quarter is the high-water mark for revenue; from here seasonality kicks in with progressively lower revenue for the next nine months.
     

  • It’s likely that cash flow will remain relatively flat for the rest of the year – the question is whether it will limit the company’s ability to invest for future growth (M&A and organic).

The bottom line: Compass’ turnaround has been an instructive case study in managing a business through a turbulent market. 

  • Like many businesses, the company was caught flat-footed last year when the market changed, but it executed a necessary turnaround to sustainability.
     

  • The broader lesson is around adaptability – it matters less how you got to where you are, and more how quickly you can adapt to a rapidly changing environment.

Zillow’s Listing Showcase Opportunity


As Zillow's Listing Showcase rolls out, it’s becoming clear that it will play a central role on the seller side of the business as it unlocks new premium revenue streams.

Why it matters: Zillow’s goal is to double its revenue and customer transaction share by 2025 – a significant undertaking – and Listing Showcase appears to be a foundational component of that strategy.


Listing Showcase is sold to agents on a subscription basis, and each geographic “zone” has a limited number of subscriptions available.

  • One subscription includes five new Showcase Listings per month (which include photos, a 3D tour, interactive floorplans, and enhanced visibility).
     

  • Subscription prices vary by thousands of dollars depending on the market, but the average appears to be around $3,000 per month.
     

  • Exclusivity is an important cornerstone of Listing Showcase: It’s possible for one agent or team to purchase all of the available subscriptions in a zone.

The revenue opportunity is significant, measured in hundreds of millions of dollars per year.

  • Assuming six million total listings per year, converting five percent of them to showcase listings at an average subscription of $3,000 per month, the revenue potential is $180 million per year (Zillow’s existing premier agent business is about $1.2 billion).


And by the way: Listing Showcase doesn't cannibalize Zillow's existing business – listing pages still have tour requests which are routed to paying premier agents. 


Perhaps most importantly, the launch of Listing Showcase gets Zillow’s paying customers on the premium product flywheel, a concept very familiar to its international portal peers.

  • Once customers start paying for premium placement (listings and exposure), they usually end up paying more and more over time.
     

  • This is ARPL (average revenue per listing), and it keeps going up, driven by consumer demand and agent exclusivity – it’s the growth engine of international real estate portals like REA Group in Australia, Rightmove in the U.K., and Hemnet in Sweden.


Zillow's goal is to double its customer transaction share – a transaction that Zillow monetizes – from three to six percent of the market.

  • Zillow reported that it had five percent of buyer customer transactions in 2021, and, as outlined above, if it's able to capture five percent of seller listings, the goal of six percent of all buyer and seller transactions is within reach.


The bottom line: Up until now, the path to Zillow's lofty goals hasn't been entirely clear – but Listing Showcase is providing tangible clarity. 

  • Listing Showcase doubles down on what the business actually is (a high-margin online advertising platform) and not something it isn’t (an unprofitable, low-margin iBuyer or mortgage company).
     

  • In other words, Listing Showcase is strategically aligned to Zillow’s DNA and sustainable competitive advantage; it is competing where it can win.

Zillow’s Most Interesting Product


In a year dominated by a confusing market, major advances in AI, and disruptors fighting for survival – Zillow has arguably released its most ambitious product since iBuying: Listing Showcase

Why it matters: Listing Showcase represents a new business model – from pay-per-lead to pay-per-listing – which is aligned to how Zillow’s very profitable international peers monetize their market-leading positions.


The Listing Showcase product promotes a specific listing with larger photos, enhanced agent branding, and premium placement in search results.

  • It’s also exclusive in each market, providing participating agents a unique advantage over other agents (“only my listings are enhanced in this market, making your property stand out”).
     

  • The result is a high profile listing with strong agent branding, ideally leading to more seller leads for partner agents.


Dig deeper: For years, seller leads have been the mythical holy grail of online real estate – incredibly valuable, but very difficult to generate at scale.

  • One surprise of the last five years was iBuying, which despite its challenges, turned out to be a great way to generate high quality, high intent seller leads (read more: Zillow's billion dollar seller lead opportunity).
     

  • Before it was shut down, Zillow Offers was generating tens of thousands of valuable seller leads per month.


Like its overseas peers, Zillow is using the concept of scarcity to increase the value of Listing Showcase; if it were available to any agent willing to pay, it would confer no unique advantage – but offered on an exclusive basis, the value becomes exponentially higher. 

  • Without an MLS, nearly all international portals charge agents (or home sellers) on a pay-per-listing basis, with multiple tiers of enhanced exposure.
     

  • Australia’s REA Group is masterful in the art of premium listings, which always include larger photos, premium placement in search results, and enhanced agent branding – all of which are features of Zillow’s Listing Showcase.


Yes, but: By only promoting the listing agent, Listing Showcase will cannibalize Zillow’s existing buyer lead business – but that’s not necessarily a bad thing.

  • Listing Showcase is a hedge against any potential impact from the various lawsuits that may restrict or change buyer agent commissions.
     

  • It also neutralizes the threat of CoStar's "your listing, your lead" product offering.

The bottom line: Listing Showcase is a serious, credible attempt by Zillow to expand its business from selling leads to selling exposure.

  • Modeled on its international peers, Listing Showcase has the hallmarks of a classic pay-to-play premium product, which, on a per listing basis, is a significant endeavor for the company. 
     

  • At its best, it’s a potential premium revenue stream that’s good for agents (the ones that pay), consumers, and Zillow's bottom line.

Brokerage Profitability


A common response to my previous analysis, Agent Compensation at the Top U.S. Brokerages, is that the brokerages paying the most out to agents couldn’t be profitable or sustainable – but, perhaps counterintuitively, the evidence suggests otherwise.

Why it matters: In a shifting market, the low-fee brokerage models are structurally designed to thrive, and are operating much more profitably than legacy brokerages.

  • To recap, the low-fee models are paying out a significantly higher percentage of their revenue to agents than legacy brokerages. 


Those same low-fee brokerages are also profitable or closest to profitability: eXp Realty, United, Real, and Fathom (RealtyONE declined to share this information with me).

  • The only companies that were profitable in Q1 2023 were eXp Realty and United Real Estate, and the largest legacy brokerages were really unprofitable.
     

  • Note: This analysis uses Adjusted EBITDA (think of it as Adjusted Earnings) as the metric of profitability – it allows a company to portray its earnings in the best possible light by backing out expenses like stock-based compensation, one-off legal or restructuring charges, and other non-cash expenses.


To account for variations in brokerage scale, we can look at Adjusted EBITDA per transaction, which yields similarly revealing results.

  • It’s worth directly comparing the two fastest-growing models of the past five years, Compass and eXp: in Q1 2023, Compass lost $1,900 per transaction, while eXp generated a profit of $130 per transaction – quite the difference.
     

  • The outlier is Douglas Elliman, which has a much smaller transaction volume (4,600 in Q1 '23, compared to 36,000 at Compass), so its loss per transaction is much higher than its peers.


The next most common response to this analysis asserts that the low-fee models don’t provide as much support to their agents. 

  • Therefore, while agents are able to “make more money,” they’re on their own and, without brokerage support, are less productive.
     

  • Once again, the evidence suggests otherwise.

Across the nine brokerages in this analysis, the average production was one transaction per agent in Q1 2023.

  • The average for the legacy brokerages (Compass, Anywhere, Keller Williams, and Douglas Elliman) was 1.03 transactions per agent, while the average for the low-fee brokerages (eXp, Real, RealtyONE, United, and Fathom) was 0.98 transactions per agent – effectively the same.
     

  • In aggregate, agents at low-fee brokerages, with “less support,” were just as productive as agents at the legacy brokerages with “lots of support.”


Variability in the number of transactions per agent over time provides further evidence: between Q4 2022 and Q1 2023, the average number of transactions per agent dropped 10 percent across the same nine brokerages.

  • Four low-fee brokerages (eXp, Real, Fathom, and RealtyONE) were at or below that average – meaning that their agents saw less of a decline in transaction volume than agents at legacy brokerages.
     

  • Support or not, agents at low-fee brokerages were more resilient and saw less variability in production during a changing market.


Yes, but: These are averages, and as with all averages, there will be overs, unders, and outliers.

  • Not all low-fee brokerages and legacy brokerages perform similarly.
     

  • Furthermore, inside of each organization, there is significant variability in individual agent performance and compensation. 

The bottom line: The dual hypotheses that low-fee brokerages aren’t sustainable, and that their agents are less productive due to less support, are false.

  • Low-fee brokerages are in fact more profitable than the legacy brokerages, even after paying out a significantly higher proportion of their revenue out to agents.
     

  • This is classic Innovator’s Dilemma: while the legacy brokerages are racing to cut costs, the low-fee models – built from the ground up with a lower cost operating model – are taking market share and competing where they can win.

Agent Compensation at the Top U.S. Brokerages


Agent compensation structures at U.S. real estate brokerages vary, with some firms paying out a significantly higher percentage of their revenue to agents than others. 

Why it matters: Commission and fee structure is foundational when it comes to agent loyalty and recruitment; as agents seek to maximize their earnings, they're naturally drawn to brokerages offering higher splits and lower fees.

Dig deeper: Brokerages generate revenue from the commission on the sale of a house. 

  • The brokerage and agent then effectively split the commission, through a varied combination of commission splits, fees, and revenue sharing.
     

  • Once added up, the result is a percentage of total brokerage revenue that is paid out to agents – ranging from 77 to 96 percent in this analysis.


The low-fee / high-split brokerages like eXp Realty, Real, RealtyONE, Fathom, and United end up paying significantly more of the commission out to agents.

  • Compass, which famously offered agents high commission splits as a recruitment incentive, is, on aggregate, closer to traditional industry stalwart Anywhere (home of Coldwell Banker and Sotheby's) than the others.

Compass is paying its agents less over time, through a combination of reducing existing agent splits, recruiting new agents with lower splits, and higher fees.

  • The one percent reduction in revenue paid out to agents over the last two years represents about $9.5 million retained by Compass and not paid out to agents in Q1 2023.


Compass highlights this achievement, which it is clearly proud of, in its quarterly earnings, declaring that its “commissions expense as a percentage of revenue” is “improving.” 

  • In fact, Compass is so pleased with this achievement that it is the first data point in its earnings press release and the second financial highlight, behind total revenue, in its investor presentation.
     

  • Enjoy it while you can; after this article, I doubt Compass will be highlighting these numbers so strongly in the future – and it certainly won’t kick off its agent gatherings with the same metrics.


Agents like to make money, so it’s unsurprising that as natural entrepreneurs they flock to brokerages where they can maximize their earning potential.

  • It’s no coincidence that the top 5 brokerages that grew agent count over the past quarter are the exact same brokerages that paid the most out to agents: eXp, Real, Fathom, RealtyONE, and United.


The bottom line: It’s a simple equation: More money attracts more agents, and more agents sell more houses.

  • Brokerages paying a smaller proportion of revenue to agents is an effective strategy to improve short-term financials, but the long-term implications around agent recruitment and retention are significant.
     

  • In a period of fewer transactions and overall belt-tightening, it's more important than ever for agents to carefully consider commission splits when deciding where to work.

Signal vs. Noise: Unpacking the “Portal Wars”


The first quarter of 2023 saw a seasonal increase in traffic for all U.S. real estate portals and, despite the hype, the competitive landscape remains unchanged.

Why it matters: For real estate portals like Zillow, traffic – consumer eyeballs – remains the lifeblood of their strategic and unrivaled power across the industry. 

Zillow added twice the amount of monthly unique users than any other portal during the quarter.

  • Absolute users are more important than percentage gains; users turn into leads, and leads turn into money.
     

  • The number of users also increases the total audience size, which is THE most important metric for an advertising platform.


Zillow has increased its commanding lead over realtor.com during the previous year.

  • This is a reflection of the overall real estate market and a change in consumer behavior, rather than anything within Zillow or realtor.com’s direct control.
     

  • During a hot housing market with limited inventory, consumers spent more time on multiple portals, but in a cooling market with significantly less people moving, consumers are simplifying their casual searches on just one portal.


The new entrant is CoStar’s Homes.com, which was acquired in May 2021. With deep pockets, CoStar is known for its heavy advertising campaigns.

  • Homes.com’s Q1 growth of 7 million monthly uniques did not come cheap; CoStar spent $112 million across all of its consumer properties during the quarter, including an increase of $55 million “primarily for SEM advertising of our residential brands.”
     

  • SEM (search engine marketing) is buying traffic.


What’s playing out in the U.S. portal space is not unique, but the latest example of network effects and the dominant position of leading portals.


The bottom line: Once the signal is separated from the noise, Zillow’s commanding position becomes clear, despite heavy investment from competitors.

  • The hype may suggest that the portal wars are heating up, but the evidence suggests no meaningful change – in fact, Zillow’s position has become even more dominant.
     

  • Furthermore, it’s not even a war; Zillow already won.

Agent Migratory Patterns


The first quarter of 2023 saw a variety of winners and losers in terms of brokerage agent count – the numerical manifestation of agent recruitment and retention.

Why it matters: As I’ve previously asserted, agents are central to the real estate transaction; growth in transaction volumes goes hand in hand with growth in agent count, because agents sell houses.

Dig deeper: Disruptive, low-fee brokerages like eXp Realty, Real Brokerage, United Real Estate, and RealtyOne all added agents during the first three months of the year.

  • Meanwhile, some of the largest incumbent brokerages and franchises – Keller Williams, RE/MAX, and Anywhere – all lost agents.


The five largest brokerages and franchises in this list – Anywhere, Keller Williams, RE/MAX, Compass, and eXp Realty – account for over 427,000 agents, down 1.1 percent from the previous quarter.

  • Among them, only eXp Realty grew its agent count from the last quarter.
     

  • Redfin, with less than 2,000 salaried principle agents, is the downside outlier after three rounds of layoffs.


Real Brokerage is the clear upside outlier, growing its agent count over 20 percent – to 10,000 agents – from the previous quarter.

  • 10,000 agents is considerably fewer than Anywhere’s 58,000 or RE/MAX’s 82,000, but Real is catching up to Compass’ 28,000 agents. 


Speaking of Compass, Q1 2023 was the first time that the brokerage’s agent count decreased.

  • Context is important: many brokerages lost agents!
     

  • But Compass is no longer in the ranks of “fast growing brokerages,” a category it dominated over the past three years – that mantle now passes to eXp Realty and Real (and several other low-fee brokerage models).


What to watch: Agent migration patterns are a significant leading indicator of future brokerage growth.

  • In a period of belt-tightening and fewer transactions, agents are moving away from traditional brands and flocking to relatively newer models where they're able to keep more of their commission.

The bottom line: Agents – and not AI, machine learning, a sophisticated CRM, a one-click transaction, nor any other tech buzzwords – sell houses.

  • This period of market scarcity reveals the brokerage business models able to thrive in a downturn, as well as those facing more fundamental challenges.
     

  • To identify the brokerage business models of the future, one simply needs to follow the agents.

Opendoor Recalibrates to a New Environment


Opendoor is rapidly recalibrating its business to a new environment: operating expenses have been cut in half while purchase volumes are down to levels not seen since the pandemic.

Why it matters:
A sustainable future for Opendoor revolves around tight cost control and operational efficiency, reducing customer acquisition costs through partnerships, and finding the right balance between offer quality and purchase volumes.

Opendoor’s monthly purchases
have dropped eightfold, to levels not seen since the early days pandemic.

  • The company has gone from purchasing 160 homes per day in June 2022 to purchasing less than 20 homes per day during the first three months of 2023.


Opendoor is purchasing fewer homes by choice – and doing so by offering less competitive offers to homeowners (offer quality).

  • This creates a greater “spread” and improves Opendoor’s ability to resell the homes for more on the open market, giving it a buffer against future market uncertainty – and exposure to profitable upside.
     

  • For example, in the Zillow + Opendoor seller options marketplace, Opendoor’s cash offer is usually considerably lower than Zillow’s estimated market value.


This quarter, Opendoor invented a helpful new financial metric, Adjusted Operating Expenses, which excludes variable costs related to selling a property: broker commissions, holding costs, and transfer fees and taxes.

  • What it reveals is Opendoor’s fixed operating expenses, a helpful measure when thinking about cost control, expense management, and operational efficiency. 
     

  • The net result is clarity around Opendoor’s recent cost-cutting: fixed operating expenses are down $100 million, or 50 percent, from Q2 2022, driven through a reduction in advertising spend, layoffs, and other cost-cutting measures.


Opendoor invested $200 million in advertising during 2022, including a significant shift to brand marketing (Opendoor’s marketing team visited my class this semester).

  • But in a shifting environment, Opendoor has slashed its advertising spend by half during the first quarter of 2023 compared to the same time last year.


A side effect of this shift is skyrocketing customer acquisition cost (CAC), as measured by total advertising spend divided by the number of homes purchased in a period.

  • Compared to 2022, Opendoor’s CAC has tripled to $16k during the first quarter of 2023 – a very unsustainable number in the long term, but one reflective of sustained brand marketing coupled with markedly fewer purchases.


The bottom line: With $1.3 billion in cash, Opendoor has the time and space to retreat, regroup, and realign the business to not only stem its losses, but position itself for future growth.

  • The evidence shows that Opendoor is making significant changes to become a more efficient operation.
     

  • Just cutting expenses at the current purchase volumes is not a sustainable strategy – but it is an important first step as the company reorients for the future.

Zillow 3.0: Is It Working?


Zillow’s latest earnings reveal growth in its core Premier Agent business after nine months of decline – the longest in the company’s history – a promising result of Zillow’s new strategy.

Why it matters: The next iteration of Zillow revolves around a back to basics strategy of generating more leads and monetizing those leads through an integrated consumer experience (a super app).

  • But a change in financial reporting will make it more difficult to track the various components of the business on its journey to building that super app.

Zillow’s Premier Agent revenue increased during the first quarter of the year, breaking a nine-month losing streak – the longest consistent revenue decline in the company’s recent history.

  • Premier Agent revenue was up 8 percent from Q4 2022 (but still down 16 percent from the heady days of early 2022, when the market was at its peak).


Comparatively, Zillow had a strong quarter – its Premier Agent business outperformed the market year-over-year and quarter-over-quarter.

  • Compared to the same period last year, overall transactions in the market were down 26 percent, compared to a 16 percent decline in Premier Agent revenue.
     

  • And compared to last quarter, market transactions were down 14 percent while Zillow managed to grow its Premier Agent revenue 8 percent – a noteworthy achievement!


Zillow’s ability to outperform the market comes down to two activities: capturing a higher percentage of leads in the market, and generating more revenue per lead.

  • Zillow’s stated goal is to double its share of customer transactions from 3 to 6 percent by the end of 2025.
     

  • ShowingTime and Flex are both designed to engage more consumers and increase conversion rates, resulting in more leads and more revenue per lead.

Zillow Home Loans is another source of revenue growth, and the company continues to invest in it.

  • The segment saw an increase in revenue during the latest quarter, but the change in financial reporting means we’ll no longer be able to see profitability for the segment – after six years of losses and two years of me writing about those losses.


Losses aside, Zillow continues to invest in its mortgage business and is hiring more mortgage loan officers (MLOs) to handle an increase in volume.


The bottom line: Zillow’s path forward is dependent on its ability to capture more leads, further monetize those leads, and attach ancillary services like mortgage – a super app leading to super revenue.

  • But Zillow’s change in financial reporting will make it more difficult to track, with any degree of granularity, which pieces of the puzzle are working well and which are struggling.
     

  • Still, the numbers (while they last) don’t lie – the company’s recent performance relative to the market underscores the powerful position Zillow occupies at the top of the consumer funnel and its ability to affect change for consumers, agents, and the entire industry.

A Comparative Study of Real Estate Portal Revenue Growth

With the books closed on 2022, the largest real estate portals around the world have demonstrated another year in a long line of consistent revenue growth.

Why it matters: The varied revenue growth between portals highlights business model differences, market share penetration, and hints at future prospects – all while reinforcing the strong position that leading real estate portals have in their respective markets.

  • The standouts are Rightmove (U.K.), Hemnet (Sweden), and Zillow (U.S.), all for a variety of reasons.

The change in revenue between 2021 (boom market) and 2022 (contracting market) highlights differing market dynamics and varied portal business models.

  • The U.S. housing market experienced higher highs in 2021 and lower lows in 2022 compared to many international markets – leading to revenue declines in 2022.
     

  • In Sweden (Hemnet) and Australia (REA Group and Domain), the homeowner pays the portal listing fee – making it easier for portals to increase prices on a fragmented audience that transacts infrequently.


Hemnet is the clear standout in terms of revenue growth over the past four years.

  • General Atlantic, a growth equity firm, acquired a majority stake in Hemnet in 2016 – and since then the business has accelerated its growth in a remarkable way.


Dig deeper: Hemnet’s revenue growth has come from increasing its average revenue per listing, with the major driver being price increases (in addition to new premium products).

  • As the only major portal in Sweden – far above any competitors – Hemnet has incredible pricing power.


On the opposite end of the spectrum, Rightmove has the slowest growth of its peers.

  • Rightmove is the dominant portal in the U.K. and its competitive position hasn’t changed in years, but the company has a more conservative growth model and tends to “stick to its knitting” more than its peers.
     

  • It’s also reached market saturation and is only able to raise prices so much each year.


The bottom line: Real estate portals are strong businesses that typically demonstrate consistent revenue growth.

  • But across the world, not all portals are created equal: markets, business models, relative pricing power, and competitive tension all factor into growth potential.
     

  • And with an asset class as financially and as psychologically valuable as real estate, customers – real estate agents and homeowners – are willing to pay more and more each year, fueling the perpetual revenue growth machine.

The Rise of Real


A relative newcomer to the industry, the Real Brokerage is growing fast and is one of the few brokerages to materially grow its transaction count in 2022.

Why it matters: In a notoriously slow moving industry, it’s worth tracking the fast movers.

Dig deeper: Real was a big winner in 2022, with its transaction count increasing by 181 percent – 24,000 units – compared to an overall industry decline of 18 percent.

  • On a unit basis, Real was second only to eXp Realty in terms of its growth.


Like other growing brokerages, the surge was fueled by agent recruitment: Real’s agent count increased 113 percent to 8,200 agents in 2022 (and has since exceeded 10k).

  • Agent count is the most reliable indicator that correlates to transaction count growth.


Cash flow: There is chatter about Real’s profitability and ability to sustain itself.

  • During 2022, Real’s cash balance fell from $29 million to $18 million – but that drop includes $10 million in acquisition-related expenses.
     

  • Outside of acquisitions, the company appears to be close to cash-flow positive.


What to watch: As we’ve seen with other brokerages, the momentum of Real’s agent recruitment will likely propel the business to continued growth in 2023.

The bottom line: It’s difficult to look at Real and not think of eXp Realty – both companies have similarly favorable agent commission splits and multi-level revenue share schemes.

  • And while future performance is uncertain, Real appears to be in the early stages of an exponential growth phase, driven by strong agent recruitment.
     

  • A receding tide reveals winners and losers in the brokerage space: The Real Brokerage is on the winning side of the ledger, growing quickly and at an increasingly meaningful scale.


Note: I’ve had coffee with Real’s CTO, but I have no financial stake nor association with Real Brokerage. I’m just looking at the data – and it’s difficult to ignore a fast-moving business in a slow-moving industry.

Incentive Splits and Agent Retention


Brokerages are employing a variety of incentives in the ever-expanding battle to win over the hearts and minds of real estate agents, including an innovative golden handcuff known as “Incentive Splits.”

Why it matters: Incentive Splits create an ever-increasing bill that an agent must repay if they leave a brokerage – which can effectively lock an agent into staying even when they want to leave.

  • This analysis focuses on Compass, where there is the most evidence, but the company is not alone in employing the practice.

Incentive Splits, a term included in some Compass agent agreements, are bonus commissions that range from 2–10 percent.

  • These commissions accumulate over time, creating an ever-growing balance that an agent must repay if they want to leave Compass.


The contract language states that if an agent leaves within two years of receiving any incentive, including an Incentive Split from a home transaction, the agent must repay all Incentives back to Compass.

  • In reviewing several contracts, this timeframe has ranged from one to three years.

The bill can add up quickly, especially for top performing agents that wish to leave: the invoice below (which may not be representative of the average Compass agent) includes over $72,000 in Incentive Splits, payable back to Compass.


Yes, but: It’s not clear how widespread this practice is – I’ve seen Incentive Splits included in the contracts of around 20 current and former Compass agents.

  • A Compass spokesperson told me that since the company stopped offering cash incentives to agents in 2022, this only impacts a small group of agents.
     

  • Compass is not alone: the invoice below from Corcoran includes a $43k bill for “Split Overpayments,” which is the same as an Incentive Split.


The incentive to agents is clear – extra cash in their pockets – but the mechanics are designed as golden handcuffs: financial incentives given to employees and contractors to discourage them from leaving a company.

  • But unlike other golden handcuffs, Incentive Splits don’t expire or vest after a certain amount of time. 

The bottom line: Incentive Splits appear to be an inventive mechanism to incentivize agents to stay with their brokerage – by creating an ever-growing bill that must be repaid if they want to leave.

  • Putting aside effectiveness and intention, the key takeaway for agents is clear: read the fine print.
     

  • Perhaps at the “brokerage of the future,” agents will stay because they want to, not because they have to.

Brokerage Winners and Losers


The market crunch is on, with 1,096,000, or 18 percent, fewer residential real estate transactions in 2022 compared to 2021.

Why it matters: It's said that a rising tide lifts all boats – but a receding tide affects boats differently, once again highlighting important differences across the brokerage landscape.

Context: According to the latest data from RealTrends, the top 20 brokerages by transaction count in 2022 (and the sample set for this analysis) were led by eXp Realty, Anywhere, HomeServices of America, Compass, and Howard Hanna.


To maintain an apples-to-apples comparison, I typically exclude franchise operations like Keller Williams, RE/MAX, and Anywhere’s franchise group because the business model is substantially different.

  • But last time I got a lot of questions about Keller Williams, so for comparison here is where KW – and its hundreds of U.S. franchisees combined – ranks (#1).


As the tide recedes, it reveals a collection of winners and losers in terms of transaction growth and decline.

  • The big winners are eXp Realty and Real Brokerage, which added 65,000 transactions, while industry incumbents Anywhere and HomeServices of America lost a combined 150,000 transactions.


When Keller Williams is added to the list, we see that it lost 190,000 transactions in 2022 compared to 2021 – more than Anywhere, HomeServices of America, and Compass combined.

  • As a percentage, KW’s 15 percent decline outperformed an overall market decline of 18 percent, but on a unit basis (revenue comes from units, not percentages) the 190k decline is substantial.


What to watch: It’s tempting – and imperative! – to draw conclusions about brokerage models from the data. 

  • The winners – eXp, Real, Fathom, Realty ONE, and United Real Estate – have one thing in common: they all offer high agent splits, per-transaction fees, or 100 percent commission models.
     

  • Meanwhile, the biggest losers are typically seen as traditional industry incumbents (but somehow also include Compass and Redfin).

The bottom line: A rising tide may lift all boats, but a receding tide slams some boats against the shore.

  • In a year of belt-tightening and fewer transactions, agents – and their transactions – appear to be flocking to relatively newer models where they keep more of their commission.

Market Shift Highlights Brokerage Fundamentals


2022 was a tumultuous year: the real estate market turned, transactions dropped, and the largest U.S. brokerages were all forced to chart new courses.

Why it matters: Agent count, transaction volumes, and the relative growth and decline of brokerages in 2022 are all powerful predictors of future performance.

Agent count continues to fuel the business of the major U.S. real estate brokerages.

  • eXp Realty is the clear stand-out, with an exponential increase in the number of its U.S. agents – which now eclipses industry incumbents Anywhere and HomeServices of America (HSoA).
     

  • Overall growth slowed across the board in 2022, and Anywhere has seen a recent uptick in agent count, which has yet to translate into a corresponding uptick in transaction count.


Transaction volumes and brokerage performance are directly correlated to agent count (MDP: “Technology doesn’t sell houses, agents do.”)

  • Among its peers, eXp Realty once again outperformed the market, growing its transactions by 12 percent in 2022, compared to an overall market decline of 18 percent.
     

  • eXp’s large brokerage peers all transacted less in 2022 than the year before, while Compass, also buoyed by recent agent count gains, experienced less of a decline than the traditional incumbents (and Redfin).


The declining market has forced companies across the industry, brokerages included, to cut costs. 

  • But those cuts are unequal among peers – cash flow and profitability dictate the speed and severity of cuts. 
     

  • Throughout the year, Anywhere and Compass, which have the highest operating expenses, have been forced to cut the deepest, while eXp and Douglas Elliman have increased their operating expenses (from a smaller base).


What to watch: Agent count growth and transaction volumes will remain sluggish in 2023.

  • A further slowing of the market will force some companies to cut even deeper.
     

  • It’s a numbers game: less transactions will go to fewer agents – so brokerages with strong agent count growth will outperform the market (just look at eXp).

The bottom line: The market correction is a great equalizer – and it’s accentuating the differences between brokerage business models.

  • In a market of musical chairs with fewer chairs available, companies with sustainable models, lower overheads, and strong recruiting are more likely to succeed.

Cash Burn Continues as Compass Navigates to Breakeven


The results are in and Compass burned $143 million in cash during Q4 2022, leaving the company with a cash balance of $362 million.

Why it matters: With a clearly articulated goal of reaching breakeven after billions in losses, 2023 is Compass’ seminal make-or-break year. 

  • Despite another quarter of high cash burn, the company appears to be positioned to achieve breakeven in 2023 after massive cuts made over the previous 12 months.
     

  • Even in a much softer market, Compass’ Q4 2022 cash burn is less than a year ago, a reflection of the cuts already made to the business.


Compass started 2023 with a cash balance of $362 million – which includes a $150 million drawdown from its revolving credit facility

  • Without that additional loan, Compass’ cash balance would have been $212 million – dangerously low for a company that just burned $143 million in a quarter.


The key to breakeven is Compass’ ability to reduce its non-GAAP operating expenses (OpEx), primarily achieved through layoffs.

  • OpEx has dropped significantly over the past six months, and is on track to drop further through the rest of the year.
     

  • It appears that Compass is aiming for OpEx of around $950 million for 2023, down about 30 percent from $1.35 billion in 2022.


It’s fair to say that any brokerage, Compass included, falls apart if it’s unable to recruit or retain agents.

  • For the first time, Compass’ agent count has gone flat, reflecting the challenging market and environment for agents (less transactions = less agents).
     

  • Yes, but: It takes several data points to create a trend, and most brokerages are seeing a similar slowdown in agent count growth.


Analysis time: Assuming Compass’ national market share and revenue per transaction remain consistent with 2022, we can see what needs to be believed for the company to reach breakeven in 2023.

  • Compass’ current non-GAAP operating expense target of $950 million suggests that 4.5 million transactions in the national market are necessary to give Compass the revenue and gross profit necessary to break even for the year.
     

  • A bear case of 4 million transactions would require Compass to cut an additional $100 million of operating expenses to reach breakeven.
     

  • Please note: these are back-of-the-envelope calculations that provide directionality, not certainty.


What to watch: Like other brokerages, Compass only has so many levers to pull to reach breakeven.

  • On the revenue side, the company is considering franchising as a less-expensive growth strategy, and will be trying to accelerate its mortgage joint venture.
     

  • If the market remains soft and revenue drops, the only option is to cut even more costs out of the business.

The bottom line: Compass is not alone in needing to cut costs during a significant market downturn – its future depends on it.

  • The company dipped into its “emergency reserve” last quarter – $150 million from its revolving credit facility – for the home stretch to profitability.
     

  • It appears that Compass has made the deep cuts necessary to achieve breakeven this year, as long as nothing else unexpectedly goes wrong.

'Go Big or Go Home': Opendoor's High-Stakes Game of Disruption


Opendoor recently posted its Q4 financial results, revealing mega losses alongside early signs of a possible turnaround.

Why it matters: In 2022, Opendoor experienced an absolutely devastating test of its business model – a worst case scenario event – and survived. 

  • The damage was brutal in terms of financial losses, but the company is still around and operating, whereas most companies would have succumbed to this type of existential event.

Behind the numbers: Opendoor posted a net loss of $1.4 billion in 2022, on top of already sizable historical losses.

  • Opendoor, and many other venture-funded disruptors, are burning billions of dollars to grow new business models – and the lack of profitability just doesn’t matter.
     

  • The most noteworthy fact is that Opendoor lost $1.4 billion in 2022 and is still operating (albeit with a new CEO).


Cash is king: Manufactured financial metrics aside, Opendoor has plenty of (but not unlimited) cash reserves.

  • Opendoor ended 2022 with $1.3 billion in cash, cash equivalents, and marketable securities – down from $2.2 billion at the beginning of the year.
     

  • That’s cash burn of $934 million – massive losses, but a scenario that Opendoor was able to weather without raising additional capital (or going bankrupt).

Like many companies, Opendoor is racing to cut its operating expenses as quickly as possible.

  • In November, it laid off about 18 percent of staff, and just recently announced that it had reduced its run-rate expenses by approximately $110 million.
     

  • Operating expenses are trending significantly lower – a positive sign for a company looking to conserve cash (note: sales, marketing and operations flex up and down based on the number of home sales).


The focal point upon which the future of the business rests is when Opendoor will turn the corner and stop selling homes for a loss.

  • Homes that Opendoor purchased in Q3 and Q4 are performing much better, with positive gross margins.
     

  • Yes, but: The first homes to sell always have the best gross margins – over time, with price reductions, gross margins fall – as expertly illustrated by Datadoor.io.

What to watch: Cash, cash, cash – Opendoor’s future as a going concern rests on its ability to fund loss-making operations.

  • With $1.3 billion in the bank and the worst behind it, the company appears to have plenty of runway.

The bottom line: Opendoor is playing a high-stakes game of disruption. 

  • With billions in the bank and billions in losses, the company is living by the creed, “go big or go home.”
     

  • After experiencing its single largest challenge in a challenging history, Opendoor persists – which may be the biggest takeaway from a brutal year.

The Path Forward for Zillow Home Loans


Zillow has been doubling, tripling, and quadrupling down on its mortgage business – which continues to lose money.

Why it matters: Zillow Homes Loans is a key part of the company's growth strategy, and an analysis of its current traction highlights the opportunities and challenges on a likely path forward.

Zillow’s mortgage business posted a $167 million loss in 2022, for a cumulative loss of $283 million since 2017.

  • Interestingly, while other mortgage businesses have enacted layoffs and race to cut costs, Zillow is keeping its mortgage operating expenses (OpEx) steady.
     

  • While revenue dropped in 2022, OpEx investment remained high – illustrating that Zillow is continuing to invest in mortgage without pressure to turn a profit.


To succeed, Zillow Home Loans must attach loans to the leads delivered through Zillow’s premier agent and flex programs.

  • Zillow reported that in Raleigh, one of its test markets, customer adoption of Zillow Home Loans increased from 15 to 20 percent.
     

  • This mirrors the progress of Redfin, which reported 21 percent mortgage attach in February compared to 17 percent in Q4.

Yes, but: Attaching mortgage is nothing new for traditional brokerages.

  • HomeServices of America and Prosperity Home Mortgage have achieved 25 percent attach rates at a national scale of over 45,000 funded loans annually – 10x the size of Zillow Home Loans.
     

  • Zillow and Redfin are both below the industry average, and may likely top out at 25 percent, something of a universal constant in the world of attaching mortgage.


Zillow's next act, announced in early 2022 after Zillow Offers was shuttered, included plans for significant revenue growth through mortgages (adjacent services).

  • A key component of this strategy is integrating Zillow Home Loans into Zillow Flex.


Behind the numbers: Zillow generated about 75,000 Flex transactions in 2022 – if the company scales Zillow Home Loans to 50 percent of its markets with a reasonable 25 percent attach rate, it would close around 9,300 loans and generate around $84 million in additional revenue.

  • A possible end goal could include doubling Flex transactions and launching in 80 percent of Zillow’s markets, with a stretch 30 percent attach rate – leading to 36,000 loans and $324 million in revenue.
     

  • These are large numbers with equally large assumptions; scaling a national mortgage operation is hard (and expensive and people-intensive). 


The bottom line: Zillow is experiencing some early wins in its journey to integrate Zillow Home Loans with its Flex program – but the path forward is uncertain, long, and expensive. 

  • Even after years of investment, Zillow Home Loans (and Redfin) is still playing catch up to the tried-and-true mortgage attach methods of the nation’s largest real estate brokerages.
     

  • A multitude of factors need to go right for Zillow to hit its goals: doubling its Flex program, convincing thousands of Flex agents to promote Zillow Home Loans, and standing up a national mortgage operation to handle 10x the volume. 

Opendoor Slows Home Acquisitions Amid Strategic Shift


After a brutal Q3 in a rapidly shifting market, Opendoor has significantly slowed down its pace of home acquisitions.

Why it matters: Profitable or not, an iBuyer must buy homes to generate revenue and remain relevant.

  • Opendoor's drop in purchase volume was rapid and extreme, but not dissimilar to changes in the past.

  • Opendoor has demonstrated an ability to quickly ramp up and down -- a sensible feature, and not a bug, of iBuying.


Lower purchase volumes mean less homes coming to market, resulting in fewer sales generating less revenue.


But Opendoor's bigger challenge is being able to resell its homes for a profit.

  • It's difficult to imagine a sustainable business model selling homes for less than it bought them for, regardless of fee.
     

  • The rubber hits the road with Opendoor's buy-to-sale premium, and the following chart from Datadoor.io shows that, improving purchase cohorts or not, Opendoor continues to sell homes at a loss.


A four year view of the same buy-to-sale premium, this time from YipitData, shows that Opendoor is well and truly in uncharted territory (and not in a good way).


What to watch: With a rapidly changing market, reeling from unprecedented financial losses, and operating under new leadership, Opendoor is undergoing a transformative moment in its history.

  • It appears to be buying fewer homes while shifting towards more asset-light models, such as Opendoor Exclusives and Power Buying (Buy with Opendoor and Opendoor Complete).
     

  • All of which raises an interesting side question: If Opendoor is buying significantly fewer homes and is guiding more consumers to its Power Buyer products, why would Zillow want to partner with them?

The bottom line: Homes are the fuel that powers the Opendoor machine.

  • As Opendoor dramatically slows down its purchase of homes, it will lose less money — but it also loses its ability to make money.
     

  • Think about it: If a coffee shop loses money on each coffee it sells, the solution is not to sell less coffee; it’s figuring out a way to sell coffee profitably.